See more : ironSource Ltd. (IS) Income Statement Analysis – Financial Results
Complete financial analysis of Alcoa Corporation (AA) income statement, including revenue, profit margins, EPS and key performance metrics. Get detailed insights into the financial performance of Alcoa Corporation, a leading company in the Aluminum industry within the Basic Materials sector.
- AURELIUS Equity Opportunities SE & Co. KGaA (AR4.DE) Income Statement Analysis – Financial Results
- Zhongyu Energy Holdings Limited (3633.HK) Income Statement Analysis – Financial Results
- Biomerica, Inc. (BMRA) Income Statement Analysis – Financial Results
- Bolt Projects Holdings, Inc. (BSLK) Income Statement Analysis – Financial Results
- Acer Incorporated (ACID.IL) Income Statement Analysis – Financial Results
Alcoa Corporation (AA)
About Alcoa Corporation
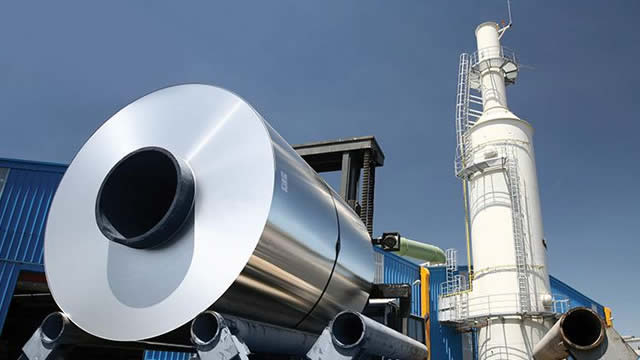
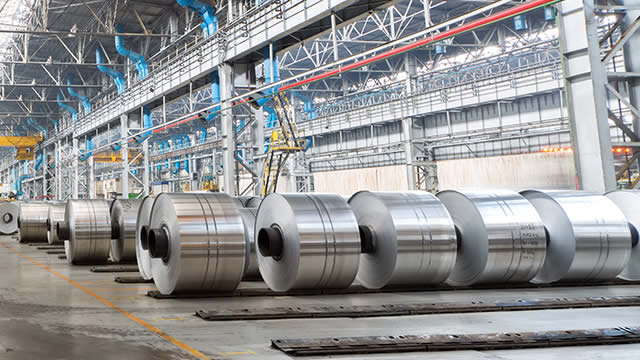
Alcoa Corporation, together with its subsidiaries, produces and sells bauxite, alumina, and aluminum products in the United States, Spain, Australia, Iceland, Norway, Brazil, Canada, and internationally. The company operates through three segments: Bauxite, Alumina, and Aluminum. It engages in bauxite mining operations; and processes bauxite into alumina and sells it to customers who process it into industrial chemical products, as well as aluminum smelting and casting businesses. The company offers primary aluminum in the form of alloy ingot or value-add ingot to customers that produce products for the transportation, building and construction, packaging, wire, and other industrial markets. In addition, it owns hydro power plants that generates and sells electricity in the wholesale market to traders, large industrial consumers, distribution companies, and other generation companies. The company was formerly known as Alcoa Upstream Corporation and changed its name to Alcoa Corporation in October 2016. The company was founded in 1888 and is headquartered in Pittsburgh, Pennsylvania.
| Metric | 2023 | 2022 | 2021 | 2020 | 2019 | 2018 | 2017 | 2016 | 2015 | 2014 | 2013 |
|---|---|---|---|---|---|---|---|---|---|---|---|
| Revenue | 10.55B | 12.76B | 12.44B | 9.37B | 10.50B | 13.52B | 11.78B | 9.33B | 11.20B | 13.15B | 12.57B |
| Cost of Revenue | 10.47B | 10.83B | 9.82B | 8.61B | 9.29B | 10.82B | 9.76B | 8.62B | 9.04B | 10.55B | 11.04B |
| Gross Profit | 86.00M | 1.93B | 2.62B | 765.00M | 1.20B | 2.69B | 2.02B | 709.00M | 2.16B | 2.60B | 1.53B |
| Gross Profit Ratio | 0.82% | 15.15% | 21.08% | 8.16% | 11.45% | 19.93% | 17.15% | 7.60% | 19.29% | 19.77% | 12.19% |
| Research & Development | 39.00M | 32.00M | 31.00M | 27.00M | 27.00M | 31.00M | 32.00M | 33.00M | 69.00M | 95.00M | 86.00M |
| General & Administrative | 0.00 | 0.00 | 0.00 | 0.00 | 0.00 | 0.00 | 0.00 | 0.00 | 0.00 | 0.00 | 0.00 |
| Selling & Marketing | 0.00 | 0.00 | 0.00 | 0.00 | 0.00 | 0.00 | 0.00 | 0.00 | 0.00 | 0.00 | 0.00 |
| SG&A | 226.00M | 204.00M | 227.00M | 206.00M | 280.00M | 248.00M | 284.00M | 359.00M | 353.00M | 383.00M | 406.00M |
| Other Expenses | 0.00 | 617.00M | 664.00M | 653.00M | 713.00M | -64.00M | 58.00M | 89.00M | 2.00M | -1.00M | -7.00M |
| Operating Expenses | 265.00M | 236.00M | 922.00M | 886.00M | 1.02B | 1.01B | 1.07B | 1.11B | 1.20B | 1.55B | 1.52B |
| Cost & Expenses | 10.73B | 11.07B | 10.08B | 8.86B | 9.56B | 11.09B | 10.14B | 9.01B | 10.24B | 12.10B | 12.56B |
| Interest Income | 0.00 | 56.00M | 195.00M | 146.00M | 121.00M | 0.00 | 0.00 | 0.00 | 0.00 | 0.00 | 0.00 |
| Interest Expense | 107.00M | 106.00M | 195.00M | 146.00M | 121.00M | 122.00M | 104.00M | 243.00M | 270.00M | 309.00M | 305.00M |
| Depreciation & Amortization | 632.00M | 617.00M | 664.00M | 653.00M | 713.00M | 733.00M | 750.00M | 718.00M | 780.00M | 954.00M | 1.03B |
| EBITDA | 155.00M | 2.03B | 2.75B | 1.02B | 396.00M | 2.45B | 2.01B | 1.19B | 713.00M | 2.17B | 57.00M |
| EBITDA Ratio | 1.47% | 16.78% | 25.62% | 11.48% | 13.60% | 22.04% | 19.73% | 11.98% | 14.74% | 14.54% | 7.67% |
| Operating Income | -227.00M | 1.53B | 2.52B | 423.00M | 714.00M | 2.20B | 1.50B | 187.00M | 958.00M | 1.05B | 15.00M |
| Operating Income Ratio | -2.15% | 11.95% | 20.28% | 4.51% | 6.80% | 16.25% | 12.70% | 2.01% | 8.55% | 8.00% | 0.12% |
| Total Other Income/Expenses | -357.00M | -995.00M | -1.55B | -359.00M | -1.17B | -599.00M | -463.00M | -373.00M | -1.13B | -1.12B | -2.76B |
| Income Before Tax | -584.00M | 723.00M | 1.20B | 173.00M | -438.00M | 1.60B | 1.16B | -162.00M | -337.00M | -63.00M | -2.75B |
| Income Before Tax Ratio | -5.54% | 5.67% | 9.64% | 1.85% | -4.17% | 11.81% | 9.84% | -1.74% | -3.01% | -0.48% | -21.85% |
| Income Tax Expense | 189.00M | 664.00M | 629.00M | 187.00M | 415.00M | 726.00M | 600.00M | 184.00M | 402.00M | 284.00M | 123.00M |
| Net Income | -651.00M | 59.00M | 429.00M | -14.00M | -853.00M | 227.00M | 217.00M | -400.00M | -863.00M | -256.00M | -2.91B |
| Net Income Ratio | -6.17% | 0.46% | 3.45% | -0.15% | -8.13% | 1.68% | 1.84% | -4.29% | -7.71% | -1.95% | -23.14% |
| EPS | -3.66 | 0.33 | 2.31 | -0.08 | -4.61 | 1.22 | 1.18 | -2.19 | -4.73 | -1.40 | -16.01 |
| EPS Diluted | -3.66 | 0.33 | 2.26 | -0.08 | -4.61 | 1.20 | 1.16 | -2.19 | -4.73 | -1.40 | -16.01 |
| Weighted Avg Shares Out | 178.00M | 181.00M | 186.00M | 186.00M | 185.00M | 186.23M | 184.42M | 182.54M | 182.40M | 182.40M | 181.70M |
| Weighted Avg Shares Out (Dil) | 178.00M | 181.00M | 190.00M | 186.00M | 185.00M | 188.53M | 186.98M | 182.54M | 182.40M | 182.40M | 181.70M |

Looking for Earnings Beat? Buy These 4 Top-Ranked Stocks

Alcoa Corporation (AA) Citi's 2024 Basic Materials Conference (Transcript)

Hunting For Magnificent Growth Next Year? Check Out These 7 Stocks.

Fmr. Alcoa CEO Klaus Kleinfeld talks impact of Trump's proposed tariffs

Alcoa Joins First Suppliers Hub - Connecting Leading Companies with Low-Carbon Aluminum Technologies

Alcoa Executive Vice President and Chief Financial Officer Molly Beerman to participate in Citi's 2024 Basic Materials Conference

Premium Resources Ltd. Announces Name Change

Alcoa CEO sees strong demand for aluminum in both near and long-term

1329293 B.C. Ltd. Announces Name Change to Auranova Resources Inc., Consolidation and Changes to Management and Board

Millbank Mining Corp. Announces Name Change to Primary Hydrogen Corp.
Source: https://incomestatements.info
Category: Stock Reports
