See more : nebag ag (NBEN.SW) Income Statement Analysis – Financial Results
Complete financial analysis of ANA Holdings Inc. (ALNPY) income statement, including revenue, profit margins, EPS and key performance metrics. Get detailed insights into the financial performance of ANA Holdings Inc., a leading company in the Airlines, Airports & Air Services industry within the Industrials sector.
- PHP Ventures Acquisition Corp. (PPHPR) Income Statement Analysis – Financial Results
- CanadaBis Capital Inc. (CANB.V) Income Statement Analysis – Financial Results
- Australian Strategic Materials Ltd (ASM.AX) Income Statement Analysis – Financial Results
- Ram-On Investments and Holdings (1999) Ltd (RMN.TA) Income Statement Analysis – Financial Results
- Cadillac Ventures Inc. (CADIF) Income Statement Analysis – Financial Results
ANA Holdings Inc. (ALNPY)
About ANA Holdings Inc.
ANA Holdings Inc., together with its subsidiaries, provides air transportation services in Japan and internationally. It operates through Air Transportation, Airline Related, Travel Services, and Trade And Retail segments. The Air Transportation segment offers domestic and international passenger operations, cargo and mail operations, and other transportation services. The Airline Related segment provides air transportation related services, such as airport passenger, ground handling, and maintenance services. The Travel Services segment engages in the development and sale of travel plans; and planning and sale of branded travel packages using air transportation. The Trade and Retail segment is involved in the import and export operations of goods related to air transportation; and in-store and non-store retailing. The company was formerly known as All Nippon Airways Co., Ltd. and changed its name to ANA Holdings Inc. in April 2013. ANA Holdings Inc. was incorporated in 1920 and is headquartered in Tokyo, Japan.
| Metric | 2024 | 2023 | 2022 | 2021 | 2020 | 2019 | 2018 | 2017 | 2016 | 2015 | 2014 | 2013 | 2012 | 2011 | 2010 | 2009 | 2008 | 2007 | 2006 | 2005 | 2004 | 2003 | 2002 | 2001 | 2000 |
|---|---|---|---|---|---|---|---|---|---|---|---|---|---|---|---|---|---|---|---|---|---|---|---|---|---|
| Revenue | 2,055.93B | 1,707.48B | 1,020.32B | 728.68B | 1,974.22B | 2,058.31B | 1,971.80B | 1,765.26B | 1,791.19B | 1,713.46B | 1,570.15B | 1,483.58B | 1,411.50B | 1,357.65B | 1,228.35B | 1,392.58B | 1,487.83B | 1,489.66B | 1,368.79B | 1,292.81B | 1,217.60B | 1,215.91B | 1,204.51B | 1,279.64B | 1,209.65B |
| Cost of Revenue | 1,642.26B | 1,425.68B | 1,074.79B | 1,026.97B | 1,611.05B | 1,584.70B | 1,503.90B | 1,343.19B | 1,355.24B | 1,335.08B | 1,238.30B | 1,148.20B | 1,086.67B | 1,071.00B | 1,049.37B | 1,124.81B | 1,114.16B | 81.23B | 86.06B | 0.00 | 0.00 | 0.00 | 0.00 | 0.00 | 0.00 |
| Gross Profit | 413.67B | 281.80B | -54.47B | -298.29B | 363.17B | 473.61B | 467.90B | 422.07B | 435.95B | 378.37B | 331.85B | 335.39B | 324.83B | 286.65B | 178.99B | 267.78B | 373.67B | 1,408.43B | 1,282.73B | 1,292.81B | 1,217.60B | 1,215.91B | 1,204.51B | 1,279.64B | 1,209.65B |
| Gross Profit Ratio | 20.12% | 16.50% | -5.34% | -40.93% | 18.40% | 23.01% | 23.73% | 23.91% | 24.34% | 22.08% | 21.13% | 22.61% | 23.01% | 21.11% | 14.57% | 19.23% | 25.11% | 94.55% | 93.71% | 100.00% | 100.00% | 100.00% | 100.00% | 100.00% | 100.00% |
| Research & Development | 0.00 | 0.00 | 0.00 | 0.00 | 0.00 | 0.00 | 0.00 | 0.00 | 0.00 | 0.00 | 0.00 | 0.00 | 0.00 | 0.00 | 0.00 | 0.00 | 0.00 | 0.00 | 0.00 | 0.00 | 0.00 | 0.00 | 0.00 | 0.00 | 0.00 |
| General & Administrative | 26.34B | 22.90B | 24.12B | 28.58B | 30.23B | 190.10B | 193.27B | 180.41B | 191.07B | 0.00 | 0.00 | 0.00 | 6.22B | 5.76B | 2.38B | 2.52B | 5.52B | 309.43B | 293.53B | 36.71B | 30.86B | 34.29B | 33.84B | 29.24B | 39.60B |
| Selling & Marketing | 61.03B | 46.10B | 21.91B | 45.07B | 115.33B | 118.49B | 110.12B | 96.13B | 108.42B | 100.96B | 84.28B | 75.22B | 69.50B | 70.85B | 79.10B | 98.78B | 108.70B | 0.00 | 0.00 | 0.00 | 0.00 | 0.00 | 0.00 | 0.00 | 0.00 |
| SG&A | 87.37B | 161.77B | 118.66B | 166.49B | 302.36B | 308.59B | 303.39B | 276.53B | 299.49B | 100.96B | 84.28B | 75.22B | 69.50B | 76.62B | 81.47B | 101.29B | 114.22B | 309.43B | 293.53B | 36.71B | 30.86B | 34.29B | 33.84B | 29.24B | 39.60B |
| Other Expenses | 118.38B | 7.05B | 16.14B | 40.54B | 1.42B | 5.14B | 3.44B | 5.37B | 7.14B | -3.02B | -4.01B | -5.33B | -7.71B | -14.59B | -16.52B | 4.38B | -14.73B | 0.00 | 0.00 | 0.00 | 0.00 | 0.00 | 0.00 | 0.00 | 0.00 |
| Operating Expenses | 205.75B | 161.77B | 118.66B | 166.49B | 302.36B | 308.59B | 303.39B | 276.53B | 299.49B | 286.89B | 271.92B | 231.56B | 227.81B | 125.78B | 131.54B | 148.98B | 163.65B | 1,397.47B | 1,279.99B | 1,215.04B | 1,183.24B | 1,218.51B | 1,181.55B | 1,197.39B | 1,178.09B |
| Cost & Expenses | 1,848.02B | 1,587.45B | 1,193.45B | 1,193.46B | 1,913.41B | 1,893.29B | 1,807.28B | 1,619.72B | 1,654.72B | 1,621.97B | 1,510.22B | 1,379.75B | 1,314.48B | 1,196.79B | 1,180.91B | 1,273.78B | 1,277.81B | 1,478.69B | 1,366.05B | 1,215.04B | 1,183.24B | 1,218.51B | 1,181.55B | 1,197.39B | 1,178.09B |
| Interest Income | 1.29B | 838.00M | 297.00M | 663.00M | 958.00M | 767.00M | 623.00M | 502.00M | 792.00M | 775.00M | 787.00M | 901.00M | 857.00M | 994.00M | 1.13B | 1.55B | 3.18B | 0.00 | 4.68B | 0.00 | 0.00 | 0.00 | 0.00 | 0.00 | 0.00 |
| Interest Expense | 23.32B | 24.85B | 25.34B | 16.69B | 6.29B | 7.00B | 8.68B | 9.80B | 11.46B | 13.73B | 15.93B | 18.03B | 19.58B | 19.31B | 18.16B | 14.83B | 15.05B | 17.71B | 20.17B | 0.00 | 0.00 | 0.00 | 0.00 | 0.00 | 0.00 |
| Depreciation & Amortization | 144.43B | 150.39B | 159.62B | 178.47B | 179.75B | 163.57B | 154.44B | 140.53B | 149.00B | 132.24B | 138.91B | 124.04B | 119.27B | 118.44B | 113.81B | 112.88B | 139.12B | 88.61B | 76.20B | 70.45B | 64.24B | 61.85B | 61.34B | 59.33B | 58.44B |
| EBITDA | 372.59B | 289.57B | 9.59B | -350.22B | 237.54B | 324.59B | 359.76B | 289.80B | 291.52B | 223.95B | 198.50B | 227.62B | 202.28B | 267.83B | 147.36B | 239.01B | 336.32B | 157.38B | 148.81B | 148.22B | 98.59B | 59.26B | 84.31B | 141.58B | 90.00B |
| EBITDA Ratio | 18.12% | 15.84% | -1.32% | -39.29% | 12.18% | 15.96% | 16.18% | 16.21% | 15.94% | 12.85% | 12.64% | 15.34% | 14.97% | 19.73% | 12.00% | 17.16% | 22.60% | 11.71% | 11.49% | 11.46% | 8.10% | 4.87% | 7.00% | 11.06% | 7.44% |
| Operating Income | 207.91B | 120.03B | -173.13B | -464.77B | 60.81B | 165.02B | 164.52B | 145.54B | 136.46B | 91.54B | 65.99B | 103.83B | 97.02B | 149.39B | 33.55B | 126.13B | 197.20B | 85.89B | 81.06B | 77.77B | 34.35B | -2.60B | 22.97B | 82.24B | 31.56B |
| Operating Income Ratio | 10.11% | 7.03% | -16.97% | -63.78% | 3.08% | 8.02% | 8.34% | 8.24% | 7.62% | 5.34% | 4.20% | 7.00% | 6.87% | 11.00% | 2.73% | 9.06% | 13.25% | 5.77% | 5.92% | 6.02% | 2.82% | -0.21% | 1.91% | 6.43% | 2.61% |
| Total Other Income/Expenses | -3.07B | -5.69B | -2.25B | -80.60B | -9.31B | -11.00B | 32.13B | -6.08B | -5.40B | -13.56B | -21.18B | -24.57B | -33.59B | -125.81B | -143.04B | -123.24B | -94.79B | -34.82B | 49.69B | -32.10B | 867.00M | -52.22B | -30.15B | -18.95B | -54.25B |
| Income Before Tax | 204.84B | 114.34B | -175.37B | -545.37B | 51.50B | 154.02B | 196.64B | 139.46B | 131.06B | 77.98B | 36.39B | 70.88B | 63.43B | 35.06B | -95.59B | -4.45B | 115.22B | 51.06B | 52.43B | 45.68B | 35.22B | -54.82B | -7.18B | 63.29B | -22.69B |
| Income Before Tax Ratio | 9.96% | 6.70% | -17.19% | -74.84% | 2.61% | 7.48% | 9.97% | 7.90% | 7.32% | 4.55% | 2.32% | 4.78% | 4.49% | 2.58% | -7.78% | -0.32% | 7.74% | 3.43% | 3.83% | 3.53% | 2.89% | -4.51% | -0.60% | 4.95% | -1.88% |
| Income Tax Expense | 46.51B | 24.24B | -33.14B | -137.68B | 25.58B | 42.19B | 51.00B | 40.16B | 52.48B | 37.96B | 18.46B | 29.07B | 35.25B | 12.03B | -38.03B | 57.00M | 50.19B | 17.37B | 20.94B | -17.63B | -10.43B | 27.83B | -2.24B | -19.15B | 5.48B |
| Net Income | 157.10B | 89.48B | -143.63B | -404.62B | 27.66B | 110.78B | 143.89B | 98.83B | 78.17B | 39.24B | 18.89B | 43.14B | 28.18B | 23.31B | -57.39B | -4.26B | 64.14B | 32.66B | 26.72B | 26.97B | 24.76B | -28.26B | -9.46B | 40.29B | -15.20B |
| Net Income Ratio | 7.64% | 5.24% | -14.08% | -55.53% | 1.40% | 5.38% | 7.30% | 5.60% | 4.36% | 2.29% | 1.20% | 2.91% | 2.00% | 1.72% | -4.67% | -0.31% | 4.31% | 2.19% | 1.95% | 2.09% | 2.03% | -2.32% | -0.79% | 3.15% | -1.26% |
| EPS | 301.62 | 190.24 | -305.37 | -1.08K | 82.66 | 331.04 | 417.82 | 282.30 | 223.60 | 22.48 | 10.82 | 27.02 | 22.44 | 18.58 | -49.33 | -4.38 | 65.86 | 33.54 | 31.28 | 34.52 | 32.28 | -36.84 | -12.34 | 55.50 | -21.08 |
| EPS Diluted | 301.62 | 170.16 | -305.37 | -1.08K | 82.66 | 331.04 | 417.82 | 282.30 | 223.60 | 22.48 | 10.82 | 27.02 | 22.44 | 18.58 | -49.33 | -4.38 | 65.86 | 33.54 | 31.28 | 30.62 | 28.20 | -36.84 | -12.34 | 49.60 | -21.08 |
| Weighted Avg Shares Out | 520.84M | 470.33M | 470.34M | 373.95M | 334.56M | 334.63M | 344.37M | 350.02M | 349.66M | 1.75B | 1.75B | 1.60B | 1.26B | 1.25B | 1.16B | 972.53M | 973.87M | 973.70M | 854.28M | 880.80M | 877.87M | 766.99M | 766.29M | 812.22M | 721.11M |
| Weighted Avg Shares Out (Dil) | 520.85M | 525.83M | 470.34M | 373.95M | 334.56M | 334.63M | 344.37M | 350.02M | 349.66M | 1.75B | 1.75B | 1.60B | 1.26B | 1.25B | 1.16B | 972.53M | 973.87M | 973.70M | 854.28M | 880.80M | 877.87M | 766.99M | 766.29M | 812.22M | 721.11M |

Interpublic Named Most Awarded Holding Company at ANA Multicultural Excellence Awards

ANA Holdings: A Risky Buy On Huge Undervaluation
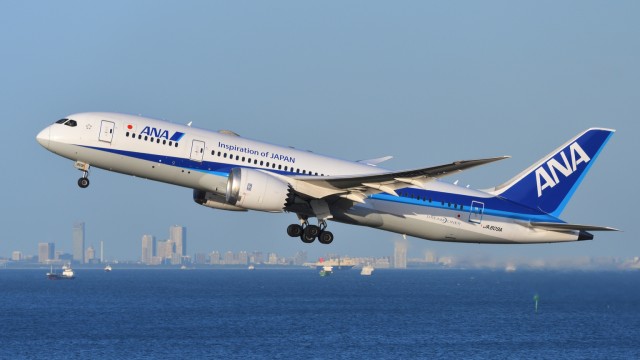
ANA Holdings Stock: Upside In A Challenging Operational Airline Environment
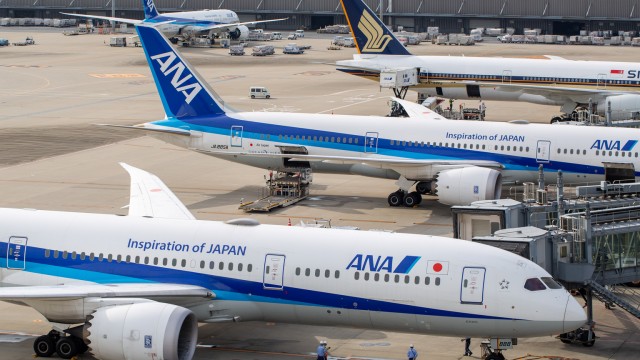
ANA Holdings: A Challenging Airline Recovery Profile

Japanese airline ANA raises full-year loss estimate

15 Stocks To Avoid Based On Valuation, Momentum And Trading Volume
Japan's ANA to raise $3.2 billion in shares to weather pandemic, pay for planes
Japan's ANA shares drop on report airline to raise $1.9 billion in share sale
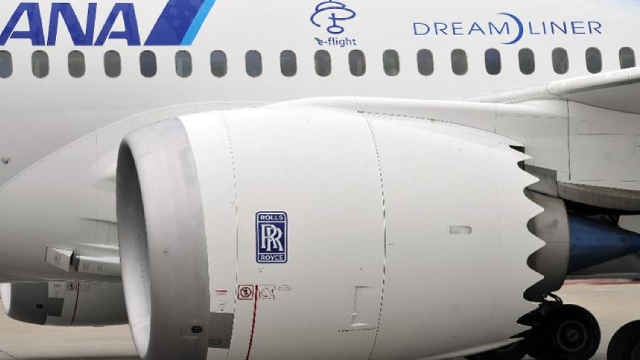
ANA’s Boeing 787 Order Switches From Rolls-Royce To GE, Out Of Practicality More Than Vengeance
Source: https://incomestatements.info
Category: Stock Reports
