See more : Sumco Corporation (SUMCF) Income Statement Analysis – Financial Results
Complete financial analysis of Aperam S.A. (APMSF) income statement, including revenue, profit margins, EPS and key performance metrics. Get detailed insights into the financial performance of Aperam S.A., a leading company in the Steel industry within the Basic Materials sector.
- TPBI Public Company Limited (TPBI.BK) Income Statement Analysis – Financial Results
- Falcon Oil & Gas Ltd. (FO.V) Income Statement Analysis – Financial Results
- Bluesky Digital Assets Corp. (BTCWF) Income Statement Analysis – Financial Results
- Clairvest Group Inc. (CVTGF) Income Statement Analysis – Financial Results
- Dalaroo Metals Ltd (DAL.AX) Income Statement Analysis – Financial Results
Aperam S.A. (APMSF)
About Aperam S.A.
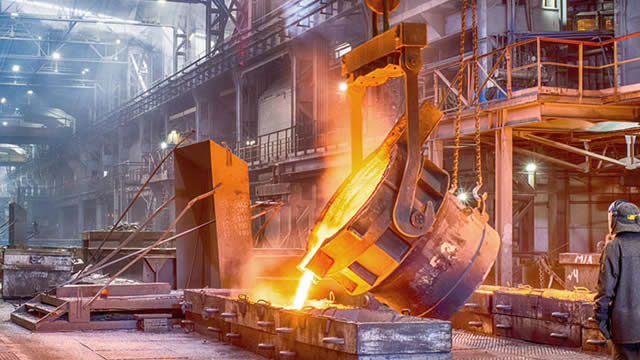
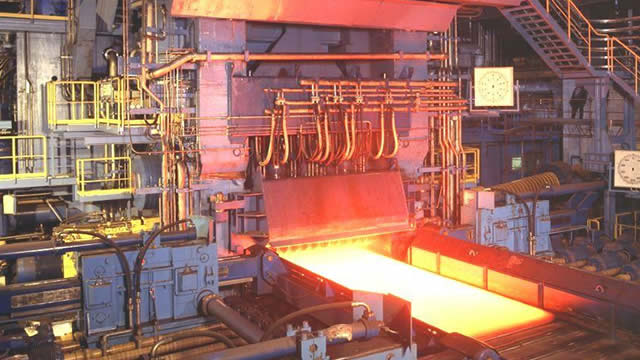
Aperam S.A., together with its subsidiaries, engages in the production and sale of stainless and specialty steel products worldwide. It operates through three segments: Stainless & Electrical Steel; Services & Solutions; and Alloys & Specialties. The company offers range of stainless steel products, including grain oriented and non-grain oriented electrical steel products, and specialty alloys. It is also involved in the distribution of its products; and the provision of transformation services that include value added and customized steel solutions. In addition, the company designs, produces, and transforms various specialty alloys and other specific stainless steels in forms, such as bars, semis, cold-rolled strips, wire and wire rods, and plates in a range on grades. It serves customers in aerospace, automotive, catering, construction, household appliances, electrical engineering, industrial processes, medical, and oil and gas industries. The company distributes its products through a network of service centers, transformation facilities, and sales offices. Aperam S.A. was incorporated in 2010 and is headquartered in Luxembourg City, Luxembourg.
| Metric | 2023 | 2022 | 2021 | 2020 | 2019 | 2018 | 2017 | 2016 | 2015 | 2014 | 2013 | 2012 | 2011 | 2010 | 2009 | 2008 | 2007 |
|---|---|---|---|---|---|---|---|---|---|---|---|---|---|---|---|---|---|
| Revenue | 6.59B | 8.16B | 5.10B | 3.62B | 4.24B | 4.68B | 4.21B | 4.06B | 4.31B | 4.51B | 3.71B | 3.98B | 4.90B | 4.21B | 2.96B | 6.00B | 6.32B |
| Cost of Revenue | 6.26B | 6.98B | 3.87B | 3.26B | 3.84B | 4.11B | 3.66B | 3.57B | 3.83B | 4.07B | 3.55B | 3.88B | 4.66B | 3.95B | 2.89B | 5.38B | 5.33B |
| Gross Profit | 330.00M | 1.18B | 1.23B | 368.00M | 397.00M | 571.00M | 555.14M | 484.93M | 480.20M | 441.61M | 157.15M | 100.57M | 236.09M | 263.17M | 62.82M | 624.96M | 995.20M |
| Gross Profit Ratio | 5.01% | 14.47% | 24.17% | 10.15% | 9.36% | 12.21% | 13.19% | 11.96% | 11.13% | 9.80% | 4.24% | 2.53% | 4.82% | 6.25% | 2.13% | 10.41% | 15.74% |
| Research & Development | 24.00M | 21.00M | 18.00M | 18.00M | 20.00M | 20.00M | 18.00M | 17.10M | 16.57M | 16.52M | 14.52M | 0.00 | 0.00 | 0.00 | 0.00 | 0.00 | 0.00 |
| General & Administrative | 97.00M | 290.00M | 191.00M | 169.00M | 190.00M | 210.00M | 182.55M | 183.51M | 181.10M | 198.19M | 165.11M | 180.72M | 201.37M | 193.24M | 207.29M | 350.55M | 375.86M |
| Selling & Marketing | 12.00M | 20.00M | 0.00 | 0.00 | 0.00 | 0.00 | 0.00 | 0.00 | 0.00 | 0.00 | 0.00 | 0.00 | 0.00 | 0.00 | 0.00 | 0.00 | 0.00 |
| SG&A | 277.00M | 290.00M | 191.00M | 169.00M | 190.00M | 210.00M | 182.55M | 183.51M | 181.10M | 198.19M | 165.11M | 180.72M | 201.37M | 193.24M | 207.29M | 350.55M | 375.86M |
| Other Expenses | -60.00M | 0.00 | 0.00 | 0.00 | 0.00 | 0.00 | 0.00 | 0.00 | 0.00 | 0.00 | 0.00 | 0.00 | 0.00 | 6.77M | 1.40M | 0.00 | 0.00 |
| Operating Expenses | 241.00M | 290.00M | 191.00M | 169.00M | 190.00M | 210.00M | 182.55M | 183.51M | 181.10M | 198.19M | 165.11M | 180.72M | 201.37M | 193.24M | 207.29M | 350.55M | 375.86M |
| Cost & Expenses | 6.50B | 7.27B | 4.06B | 3.43B | 4.03B | 4.32B | 3.84B | 3.75B | 4.01B | 4.26B | 3.72B | 4.06B | 4.86B | 4.14B | 3.10B | 5.73B | 5.70B |
| Interest Income | 10.00M | 22.00M | 13.00M | 68.00M | 2.00M | 5.00M | 1.67M | 3.80M | 3.66M | 4.11M | 4.35M | 2.27M | 2.31M | 6.77M | 6.98M | 42.38M | 24.69M |
| Interest Expense | 43.00M | 22.00M | 10.00M | 9.00M | 27.00M | 4.00M | 27.51M | 38.03M | 49.39M | 72.37M | 66.62M | 57.47M | 56.32M | 6.77M | 8.38M | 88.36M | 70.64M |
| Depreciation & Amortization | 204.00M | 186.00M | 144.00M | 144.00M | 150.00M | 143.00M | 152.00M | 166.40M | 159.15M | 199.83M | 210.01M | 221.55M | 236.87M | 220.31M | 222.65M | 229.15M | 188.61M |
| EBITDA | 364.00M | 1.08B | 1.20B | 391.00M | 362.00M | 504.00M | 538.00M | 467.81M | 417.08M | 373.35M | 212.04M | 145.18M | 210.63M | 384.22M | 76.78M | 503.56M | 822.36M |
| EBITDA Ratio | 5.52% | 13.29% | 23.46% | 10.98% | 8.42% | 10.22% | 12.10% | 11.70% | 9.44% | 8.23% | 4.65% | 3.69% | 4.41% | 7.21% | 2.60% | 8.39% | 13.01% |
| Operating Income | 89.00M | 890.00M | 1.04B | 199.00M | 207.00M | 361.00M | 372.59M | 301.42M | 299.09M | 243.42M | -7.97M | -80.15M | 34.72M | 69.93M | -144.48M | 274.41M | 619.34M |
| Operating Income Ratio | 1.35% | 10.91% | 20.42% | 5.49% | 4.88% | 7.72% | 8.85% | 7.43% | 6.93% | 5.40% | -0.21% | -2.01% | 0.71% | 1.66% | -4.89% | 4.57% | 9.79% |
| Total Other Income/Expenses | 28.00M | -138.00M | 1.00M | 39.00M | -22.00M | -4.00M | -44.00M | -38.03M | -90.55M | -142.27M | -95.59M | -55.95M | -117.28M | 6.77M | 0.00 | -160.19M | -80.25M |
| Income Before Tax | 117.00M | 752.00M | 1.04B | 238.00M | 185.00M | 357.00M | 331.75M | 263.38M | 208.54M | 101.15M | -103.56M | -130.06M | -82.56M | 76.69M | -109.58M | 114.22M | 539.09M |
| Income Before Tax Ratio | 1.77% | 9.22% | 20.44% | 6.57% | 4.36% | 7.63% | 7.88% | 6.49% | 4.83% | 2.24% | -2.79% | -3.27% | -1.69% | 1.82% | -3.71% | 1.90% | 8.53% |
| Income Tax Expense | -87.00M | 126.00M | 74.00M | 63.00M | 37.00M | 71.00M | 30.84M | 59.90M | 50.31M | 23.03M | -31.86M | -48.39M | -37.03M | -2.26M | -25.82M | 43.82M | 155.69M |
| Net Income | 203.00M | 625.00M | 968.00M | 175.00M | 148.00M | 286.00M | 320.00M | 203.48M | 157.32M | 78.12M | -72.42M | -81.66M | -46.29M | 78.20M | -83.76M | 42.38M | 272.98M |
| Net Income Ratio | 3.08% | 7.66% | 18.97% | 4.83% | 3.49% | 6.12% | 7.60% | 5.02% | 3.65% | 1.73% | -1.95% | -2.05% | -0.95% | 1.86% | -2.83% | 0.71% | 4.32% |
| EPS | 2.79 | 8.33 | 12.21 | 2.19 | 1.82 | 3.21 | 4.00 | 2.61 | 2.02 | 1.00 | -0.93 | -1.05 | -0.59 | 1.01 | -1.07 | 0.54 | 3.50 |
| EPS Diluted | 2.79 | 8.29 | 12.16 | 2.19 | 1.82 | 3.21 | 3.80 | 2.46 | 1.91 | 0.96 | -0.93 | -1.05 | -0.59 | 1.01 | -1.07 | 0.54 | 3.50 |
| Weighted Avg Shares Out | 72.76M | 75.06M | 79.24M | 79.84M | 81.17M | 89.05M | 80.01M | 77.67M | 77.97M | 78.02M | 78.05M | 78.05M | 78.05M | 78.05M | 78.05M | 78.05M | 78.05M |
| Weighted Avg Shares Out (Dil) | 72.78M | 75.40M | 79.56M | 80.15M | 81.43M | 89.05M | 88.54M | 87.04M | 87.42M | 81.43M | 78.05M | 78.05M | 78.05M | 78.05M | 78.05M | 78.05M | 78.05M |

Aperam: Overcoming Cyclical Challenges, Positioned For Future Growth In Evolving Steel Market

Aperam: A 6.9% Dividend Yield While Waiting For A Demand Uptick

Aperam: After Rain Comes Sunshine

Aperam S.A. (APEMY) Q2 2023 Earnings Call Transcript

Aperam: Offering A 7% Dividend Yield, Trading At 7x Earnings
Source: https://incomestatements.info
Category: Stock Reports
