See more : Mars Acquisition Corp. (MARXU) Income Statement Analysis – Financial Results
Complete financial analysis of Arafura Rare Earths Limited (ARAFF) income statement, including revenue, profit margins, EPS and key performance metrics. Get detailed insights into the financial performance of Arafura Rare Earths Limited, a leading company in the Industrial Materials industry within the Basic Materials sector.
- A.G. BARR p.l.c. (BAGFF) Income Statement Analysis – Financial Results
- Industrias Peñoles, S.A.B. de C.V. (PE&OLES.MX) Income Statement Analysis – Financial Results
- TwentyFour Select Monthly Income Fund Limited (SMIF.L) Income Statement Analysis – Financial Results
- Gentrack Group Limited (GTK.AX) Income Statement Analysis – Financial Results
- Gruppo MutuiOnline S.p.A (MOL.MI) Income Statement Analysis – Financial Results
Arafura Rare Earths Limited (ARAFF)
About Arafura Rare Earths Limited
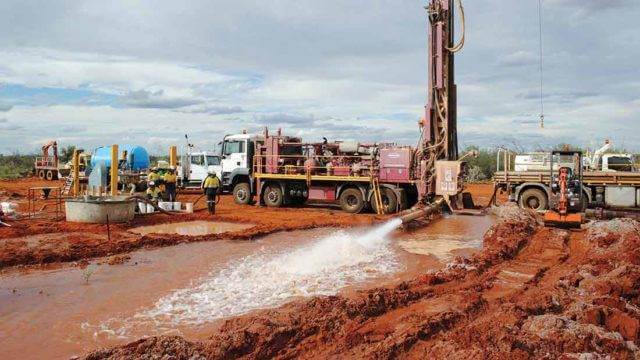
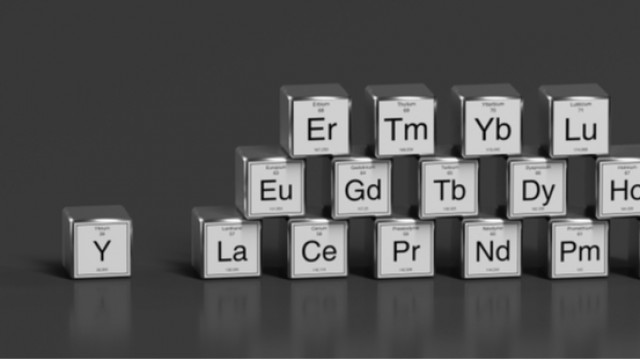
Arafura Rare Earths Limited explores for and develops mineral properties in Australia. It focuses on the production of rare earth products, such as neodymium-praseodymium and mixed middle-heavy rare earths oxides. The company's principal property is the Nolans project, a rare earths-phosphate-uranium-thorium deposit that supplies neodymium and praseodymium products located in Northern Territory, Australia. It also engages in mining and associated infrastructure, and social and environmental feasibility evaluations. The company was formerly known as Arafura Resources Limited and changed its name to Arafura Rare Earths Limited in October 2022. Arafura Rare Earths Limited was incorporated in 1997 and is based in Perth, Australia.
| Metric | 2024 | 2023 | 2022 | 2021 | 2020 | 2019 | 2018 | 2017 | 2016 | 2015 | 2014 | 2013 | 2012 | 2011 | 2010 | 2009 | 2008 | 2007 | 2006 | 2005 | 2004 | 2003 |
|---|---|---|---|---|---|---|---|---|---|---|---|---|---|---|---|---|---|---|---|---|---|---|
| Revenue | 0.00 | 0.00 | 0.00 | 0.00 | 0.00 | 0.00 | 247.63K | 276.44K | 376.33K | 615.30K | 737.74K | 1.58M | 0.00 | 0.00 | 0.00 | 0.00 | 1.97M | 380.36K | 0.00 | 75.00K | 0.00 | 22.82K |
| Cost of Revenue | 8.41M | 577.03K | 318.57K | 280.40K | 97.75K | 184.63K | 63.02K | 46.72K | 55.59K | 0.00 | 0.00 | 0.00 | 0.00 | 0.00 | 0.00 | 0.00 | 0.00 | 0.00 | 0.00 | 0.00 | 0.00 | 0.00 |
| Gross Profit | -8.41M | -577.03K | -318.57K | -280.40K | -97.75K | -184.63K | 184.61K | 229.72K | 320.74K | 615.30K | 737.74K | 1.58M | 0.00 | 0.00 | 0.00 | 0.00 | 1.97M | 380.36K | 0.00 | 75.00K | 0.00 | 22.82K |
| Gross Profit Ratio | 0.00% | 0.00% | 0.00% | 0.00% | 0.00% | 0.00% | 74.55% | 83.10% | 85.23% | 100.00% | 100.00% | 100.00% | 0.00% | 0.00% | 0.00% | 0.00% | 100.00% | 100.00% | 0.00% | 100.00% | 0.00% | 100.00% |
| Research & Development | 0.00 | 0.00 | 0.00 | 0.00 | 0.00 | 0.00 | 0.00 | 0.00 | 0.00 | 0.00 | 0.00 | 0.00 | 0.00 | 0.00 | 0.00 | 0.00 | 0.00 | 0.00 | 0.00 | 0.00 | 0.00 | 0.00 |
| General & Administrative | 0.00 | 4.14M | 3.23M | 2.83M | 3.00M | 3.11M | 2.21M | 2.27M | 2.75M | 2.97M | 4.02M | 3.93M | 6.49M | 7.03M | 6.08M | 5.85M | 3.55M | 3.17M | 1.24M | 505.97K | 397.40K | 43.39K |
| Selling & Marketing | 0.00 | 94.93M | 0.00 | 0.00 | 0.00 | 0.00 | 0.00 | 0.00 | 0.00 | 0.00 | 0.00 | 0.00 | 15.16K | 30.76K | 28.99K | 76.65K | 432.97K | 233.22K | 194.68K | 37.22K | 0.00 | 0.00 |
| SG&A | 97.84M | 99.07M | 3.23M | 2.83M | 3.00M | 3.11M | 2.21M | 2.27M | 2.75M | 2.97M | 4.02M | 3.93M | 6.50M | 7.06M | 6.11M | 5.93M | 3.98M | 3.40M | 1.44M | 543.19K | 397.40K | 43.39K |
| Other Expenses | 0.00 | 106.25K | 47.74K | 209.36K | 330.62K | 446.06K | 659.08K | 846.47K | 481.91K | 1.18M | 570.42K | -5.43M | 523.22K | -5.93K | 166.06K | 971.86K | 2.23M | 221.12K | 422.70K | -100.02K | 375.00K | 0.00 |
| Operating Expenses | 97.84M | 99.07M | 35.72M | 6.77M | 5.40M | 6.25M | 6.02M | 4.53M | 32.78M | 6.00M | 7.24M | 7.67M | 11.24M | 10.79M | 10.65M | 14.25M | 11.74M | 6.02M | 2.49M | 884.55K | 661.50K | 146.51K |
| Cost & Expenses | 106.25M | 99.65M | 35.72M | 6.77M | 5.40M | 6.25M | 6.02M | 4.53M | 32.78M | 6.00M | 7.24M | 7.67M | 11.24M | 10.79M | 10.65M | 14.25M | 11.74M | 6.02M | 2.49M | 884.55K | 661.50K | 146.51K |
| Interest Income | 2.34M | 3.20M | 130.39K | 107.88K | 312.76K | 127.23K | 247.63K | 276.44K | 376.33K | 615.30K | 962.69K | 1.34M | 2.10M | 3.35M | 529.24K | 325.05K | 809.75K | 378.89K | 130.08K | 95.70K | 95.54K | 0.00 |
| Interest Expense | 107.78K | 34.88K | 11.77K | 12.21K | 6.35K | 5.42K | 4.69K | 4.88K | 5.56K | 7.79K | 4.97K | 1.53K | 2.96K | 5.56K | 5.51K | 8.37K | 17.92K | 8.39K | 2.86K | 0.00 | 1.56K | 0.00 |
| Depreciation & Amortization | 8.41M | 577.03K | 318.57K | 280.40K | 97.75K | 184.63K | 63.02K | 46.72K | 55.59K | 118.80K | 94.07K | 119.34K | 181.95K | 230.37K | 252.67K | 215.89K | 151.95K | 44.96K | 20.21K | 8.22K | 2.72K | 721.00 |
| EBITDA | -97.84M | -95.79M | -35.23M | -6.19M | -4.67M | -5.57M | -5.05M | -3.36M | -31.86M | -4.08M | -5.63M | -11.64M | -8.44M | -7.22M | -9.70M | -12.73M | -6.58M | -5.00M | -1.63M | -801.33K | -187.56K | 0.00 |
| EBITDA Ratio | 0.00% | 0.00% | 0.00% | 0.00% | 0.00% | 0.00% | -2,038.41% | -1,216.09% | -8,467.09% | -663.34% | -760.56% | -738.84% | 0.00% | 0.00% | 0.00% | 0.00% | -334.29% | -1,313.23% | 0.00% | -1,068.44% | 0.00% | -538.85% |
| Operating Income | -106.25M | -99.65M | -35.55M | -6.47M | -4.77M | -5.68M | -5.11M | -3.41M | -31.92M | -4.20M | -5.71M | -11.76M | -8.62M | -7.45M | -9.95M | -12.95M | -6.73M | -5.04M | -1.65M | -809.55K | -190.28K | -123.69K |
| Operating Income Ratio | 0.00% | 0.00% | 0.00% | 0.00% | 0.00% | 0.00% | -2,063.86% | -1,232.99% | -8,481.86% | -682.65% | -773.31% | -746.42% | 0.00% | 0.00% | 0.00% | 0.00% | -342.01% | -1,325.05% | 0.00% | -1,079.39% | 0.00% | -542.01% |
| Total Other Income/Expenses | 5.23M | 3.20M | 144.27K | 140.65K | 262.48K | -49.66K | -5.18K | -5.66K | -474.38K | 8.40K | -1.16M | -7.65M | -71.22K | -11.55K | -182.82K | -732.24K | -17.92K | -8.39K | -2.86K | 95.70K | -1.56K | 0.00 |
| Income Before Tax | -101.03M | -96.41M | -35.56M | -6.48M | -4.81M | -5.85M | -5.12M | -3.41M | -31.92M | -4.21M | -6.88M | -11.76M | -8.69M | -7.46M | -10.13M | -13.68M | -6.75M | -5.05M | -1.65M | -713.85K | -191.84K | -123.69K |
| Income Before Tax Ratio | 0.00% | 0.00% | 0.00% | 0.00% | 0.00% | 0.00% | -2,065.76% | -1,234.75% | -8,483.34% | -683.91% | -932.73% | -746.52% | 0.00% | 0.00% | 0.00% | 0.00% | -342.92% | -1,327.26% | 0.00% | -951.80% | 0.00% | -542.01% |
| Income Tax Expense | -50.68K | -34.66K | 59.51K | 221.57K | 336.96K | 451.48K | 663.77K | 851.35K | 487.47K | 1.19M | 575.39K | -5.43M | 526.18K | -374.00 | 171.57K | 980.23K | -374.75K | 229.52K | 425.56K | -713.85K | -191.84K | -123.69K |
| Net Income | -100.97M | -96.38M | -35.56M | -6.48M | -4.81M | -5.85M | -5.12M | -3.41M | -31.92M | -4.21M | -6.88M | -11.76M | -8.69M | -7.46M | -10.13M | -13.68M | -6.37M | -5.05M | -1.65M | -713.85K | -191.84K | -123.69K |
| Net Income Ratio | 0.00% | 0.00% | 0.00% | 0.00% | 0.00% | 0.00% | -2,065.76% | -1,234.75% | -8,483.34% | -683.91% | -932.73% | -746.52% | 0.00% | 0.00% | 0.00% | 0.00% | -323.88% | -1,327.26% | 0.00% | -951.80% | 0.00% | -542.01% |
| EPS | -0.05 | -0.05 | -0.02 | -0.01 | 0.00 | -0.01 | -0.01 | -0.01 | -0.07 | -0.01 | -0.01 | -0.03 | -0.02 | -0.02 | -0.03 | -0.07 | -0.04 | -0.04 | -0.02 | -0.01 | 0.00 | 0.00 |
| EPS Diluted | -0.05 | -0.05 | -0.02 | -0.01 | 0.00 | -0.01 | -0.01 | -0.01 | -0.07 | -0.01 | -0.01 | -0.03 | -0.02 | -0.02 | -0.03 | -0.07 | -0.04 | -0.04 | -0.02 | -0.01 | 0.00 | 0.00 |
| Weighted Avg Shares Out | 2.21B | 1.91B | 1.53B | 1.17B | 1.05B | 680.83M | 629.37M | 524.94M | 490.45M | 490.47M | 490.47M | 470.76M | 417.61M | 378.17M | 292.74M | 199.39M | 161.15M | 117.02M | 76.48M | 58.80M | 50.63M | 56.66M |
| Weighted Avg Shares Out (Dil) | 2.21B | 1.91B | 1.53B | 1.17B | 1.05B | 680.83M | 629.39M | 524.96M | 490.47M | 490.47M | 490.47M | 470.76M | 417.61M | 378.17M | 292.74M | 199.39M | 161.15M | 117.02M | 76.48M | 58.80M | 50.63M | 56.66M |

Arafura Rare Earths Ltd. (ARAFF) Q1 2024 Earnings Call Transcript

Arafura Rare Earths Limited (ARAFF) Q4 2023 Earnings Call Transcript

Arafura Resources awards Hatch engineering design contract for Nolans hydrometallurgical plant

Arafura Resources directors demonstrate faith in rare earth strategy through SPP participation

Arafura Resources focuses on Final Investment Decision in mid-2022 for Nolans project

Arafura Resources completes $18.92 million second tranche of $40 million placement

Arafura Resources will close $5.5 million SPP early following strong shareholder demand

Arafura Resources steams ahead at Nolans rare earth project with FEED activities set to start

Arafura Resources completes $21 million first tranche of strongly supported $40 million placement

Arafura Resources eyes $45 million equity raise to support Nolans Project FEED studies
Source: https://incomestatements.info
Category: Stock Reports
