See more : JMT Auto Limited (JMTAUTOLTD.NS) Income Statement Analysis – Financial Results
Complete financial analysis of Artemis Resources Limited (ARTTF) income statement, including revenue, profit margins, EPS and key performance metrics. Get detailed insights into the financial performance of Artemis Resources Limited, a leading company in the Industrial Materials industry within the Basic Materials sector.
- Chesapeake Energy Corporation (CHKEL) Income Statement Analysis – Financial Results
- Betsson AB (BETS-B.ST) Income Statement Analysis – Financial Results
- Arbor Realty Trust, Inc. (ABR-PB) Income Statement Analysis – Financial Results
- Metair Investments Limited (MTA.JO) Income Statement Analysis – Financial Results
- Hindustan Zinc Limited (HINDZINC.NS) Income Statement Analysis – Financial Results
Artemis Resources Limited (ARTTF)
About Artemis Resources Limited
Artemis Resources Limited engages in the exploration and development of mineral properties. The company explores for gold, nickel, cobalt, and copper deposits. Its flagship projects include the Carlow Castle Gold-Copper-Cobalt project located in the West Pilbara region of Western Australia; and the Paterson Central Gold-Copper project covering an area of approximately 605 square kilometers located in the Yaneena Basin of the Paterson Province, Western Australia. Artemis Resources Limited was incorporated in 2003 and is based in Subiaco, Australia.
| Metric | 2024 | 2023 | 2022 | 2021 | 2020 | 2019 | 2018 | 2017 | 2016 | 2015 | 2014 | 2013 | 2012 | 2011 | 2010 | 2009 | 2008 | 2007 |
|---|---|---|---|---|---|---|---|---|---|---|---|---|---|---|---|---|---|---|
| Revenue | 240.38K | 80.17K | 33.39K | 133.82K | 185.22K | 7.00K | 18.77M | 628.86K | 202.61K | 100.30K | 4.27K | 16.30K | 0.00 | 0.00 | 0.00 | 0.00 | 0.00 | 0.00 |
| Cost of Revenue | 0.00 | 201.77K | 97.99K | 38.62K | 165.70K | 8.00K | 174.48K | 161.86K | 0.00 | 0.00 | 0.00 | 0.00 | 0.00 | 0.00 | 0.00 | 0.00 | 0.00 | 0.00 |
| Gross Profit | 240.38K | -121.60K | -64.60K | 95.20K | 19.52K | -1.00K | 18.59M | 467.00K | 202.61K | 100.30K | 4.27K | 16.30K | 0.00 | 0.00 | 0.00 | 0.00 | 0.00 | 0.00 |
| Gross Profit Ratio | 100.00% | -151.68% | -193.47% | 71.14% | 10.54% | -14.33% | 99.07% | 74.26% | 100.00% | 100.00% | 100.00% | 100.00% | 0.00% | 0.00% | 0.00% | 0.00% | 0.00% | 0.00% |
| Research & Development | 0.00 | 0.00 | 0.00 | 0.00 | 0.00 | 0.00 | 0.00 | 0.00 | 0.00 | 0.00 | 0.00 | 0.00 | 0.00 | 0.00 | 0.00 | 0.00 | 0.00 | 0.00 |
| General & Administrative | 1.06M | 1.11M | 1.14M | 2.41M | 2.04M | 5.09M | 3.48M | 1.86M | 242.76K | 325.11K | 575.85K | 348.04K | 417.69K | 1.13M | 1.02M | 1.07M | 317.12K | 109.39K |
| Selling & Marketing | 130.03K | 69.11K | 103.30K | 232.11K | 270.25K | 358.22K | 92.44K | 111.86K | 0.00 | 0.00 | 0.00 | 0.00 | 0.00 | 0.00 | 0.00 | 20.50K | 47.72K | 0.00 |
| SG&A | 1.34M | 2.72M | 1.24M | 2.64M | 2.31M | 5.45M | 3.57M | 1.97M | 242.76K | 325.11K | 575.85K | 348.04K | 417.69K | 1.13M | 1.02M | 1.09M | 364.83K | 109.39K |
| Other Expenses | 0.00 | 80.06K | 1.06M | 834.29K | 3.48M | -310.30K | -99.72K | -100.00K | 202.61K | 100.30K | -24.15K | 46.30K | 101.00K | 1.84M | 305.20K | -11.73K | 37.35K | -448.51K |
| Operating Expenses | 1.34M | 2.64M | 8.59M | 11.26M | 15.07M | 8.23M | 5.94M | 2.48M | 6.65M | 4.00M | 1.96M | 1.20M | 2.03M | 7.09M | 4.74M | 6.67M | 1.37M | 530.61K |
| Cost & Expenses | 1.34M | 2.85M | 8.59M | 11.30M | 15.24M | 8.23M | 6.11M | 2.64M | 6.65M | 4.00M | 1.96M | 1.20M | 2.03M | 7.09M | 4.74M | 6.67M | 1.37M | 530.61K |
| Interest Income | 0.00 | 107.00 | 1.22K | 7.40K | 3.29K | 5.13K | 160.86K | 4.64K | 783.00 | 7.24K | 13.72K | 45.31K | 289.74K | 141.88K | 97.42K | 144.05K | 189.20K | 116.84K |
| Interest Expense | 0.00 | 13.54K | 0.00 | 28.46K | 705.47K | 814.82K | 642.88K | 236.31K | 33.54K | 52.35K | 0.00 | 25.00K | 0.00 | 0.00 | 0.00 | 4.58K | 424.00 | 480.00 |
| Depreciation & Amortization | 73.70K | 201.77K | 97.99K | 115.74K | 180.01K | 75.21K | 18.04K | 2.00K | 5.76M | 2.23M | 6.77K | 11.67K | 18.53K | 24.47K | 4.41K | 11.49K | 1.91K | 395.00 |
| EBITDA | -1.24M | -2.64M | -8.59M | -10.46M | -11.57M | -8.53M | 12.72M | -1.94M | -6.44M | -3.90M | -1.96M | -1.09M | -2.02M | -7.06M | -4.74M | -6.53M | -1.14M | -413.37K |
| EBITDA Ratio | -516.77% | -3,298.93% | -25,733.86% | -7,813.14% | -6,245.58% | -121,898.86% | 67.76% | -308.84% | -3,180.50% | -3,884.39% | -45,837.96% | -6,705.44% | 0.00% | 0.00% | 0.00% | 0.00% | 0.00% | 0.00% |
| Operating Income | -1.10M | -2.85M | -8.59M | -10.46M | -11.57M | -8.53M | 12.71M | -1.94M | -6.44M | -3.90M | -1.96M | -1.10M | -2.03M | -7.09M | -4.74M | -6.54M | -1.14M | -413.77K |
| Operating Income Ratio | -459.17% | -3,550.61% | -25,733.86% | -7,813.14% | -6,245.58% | -121,898.86% | 67.70% | -308.84% | -3,180.50% | -3,884.39% | -45,996.39% | -6,777.03% | 0.00% | 0.00% | 0.00% | 0.00% | 0.00% | 0.00% |
| Total Other Income/Expenses | -15.49M | -14.79M | -5.61M | -6.91M | -8.01M | -1.12M | -632.47K | -331.68K | -5.86M | -2.36M | -919.79K | -178.40K | 390.74K | 1.98M | 402.62K | -4.58K | -424.00 | -480.00 |
| Income Before Tax | -16.59M | -16.92M | -7.53M | -10.48M | -12.27M | -9.35M | 12.07M | -2.18M | -6.48M | -3.95M | -1.97M | -1.13M | -1.64M | -5.11M | -4.34M | -6.54M | -1.14M | -414.25K |
| Income Before Tax Ratio | -6,902.37% | -21,109.83% | -22,550.38% | -7,834.41% | -6,626.47% | -133,539.13% | 64.33% | -346.42% | -3,197.05% | -3,936.58% | -46,240.68% | -6,930.38% | 0.00% | 0.00% | 0.00% | 0.00% | 0.00% | 0.00% |
| Income Tax Expense | 0.00 | 1.00 | -99.20K | 747.01K | 4.01M | 429.31K | 532.76K | 134.31K | -5.52M | -2.08M | -13.72K | 71.30K | -291.07K | -282.20K | -277.21K | -7.15K | 35.55K | -470.48K |
| Net Income | -16.59M | -16.92M | -7.53M | -10.48M | -12.27M | -9.35M | 12.07M | -2.18M | -6.48M | -3.95M | -1.97M | -1.13M | -1.64M | -4.97M | -4.16M | -6.54M | -1.14M | -391.80K |
| Net Income Ratio | -6,902.37% | -21,109.83% | -22,550.38% | -7,834.41% | -6,626.47% | -133,539.13% | 64.33% | -346.42% | -3,197.05% | -3,936.58% | -46,240.68% | -6,930.38% | 0.00% | 0.00% | 0.00% | 0.00% | 0.00% | 0.00% |
| EPS | -0.01 | -0.01 | -0.01 | -0.01 | -0.01 | -0.01 | 0.02 | -0.01 | -0.05 | -0.04 | -0.04 | -0.03 | -0.04 | -0.22 | -0.33 | -1.02 | -0.22 | -0.19 |
| EPS Diluted | -0.01 | -0.01 | -0.01 | -0.01 | -0.01 | -0.01 | 0.02 | -0.01 | -0.05 | -0.04 | -0.04 | -0.03 | -0.04 | -0.22 | -0.33 | -1.02 | -0.22 | -0.19 |
| Weighted Avg Shares Out | 1.65B | 1.44B | 1.31B | 1.13B | 907.19M | 649.04M | 597.72M | 229.37M | 126.23M | 89.49M | 53.42M | 37.59M | 36.94M | 22.79M | 12.50M | 6.40M | 5.30M | 2.02M |
| Weighted Avg Shares Out (Dil) | 1.65B | 1.44B | 1.31B | 1.13B | 907.19M | 649.04M | 597.72M | 229.37M | 126.23M | 89.49M | 53.42M | 37.59M | 36.94M | 22.79M | 12.50M | 6.40M | 5.30M | 2.02M |
Artemis Resources appoints exploration heavyweight as technical director
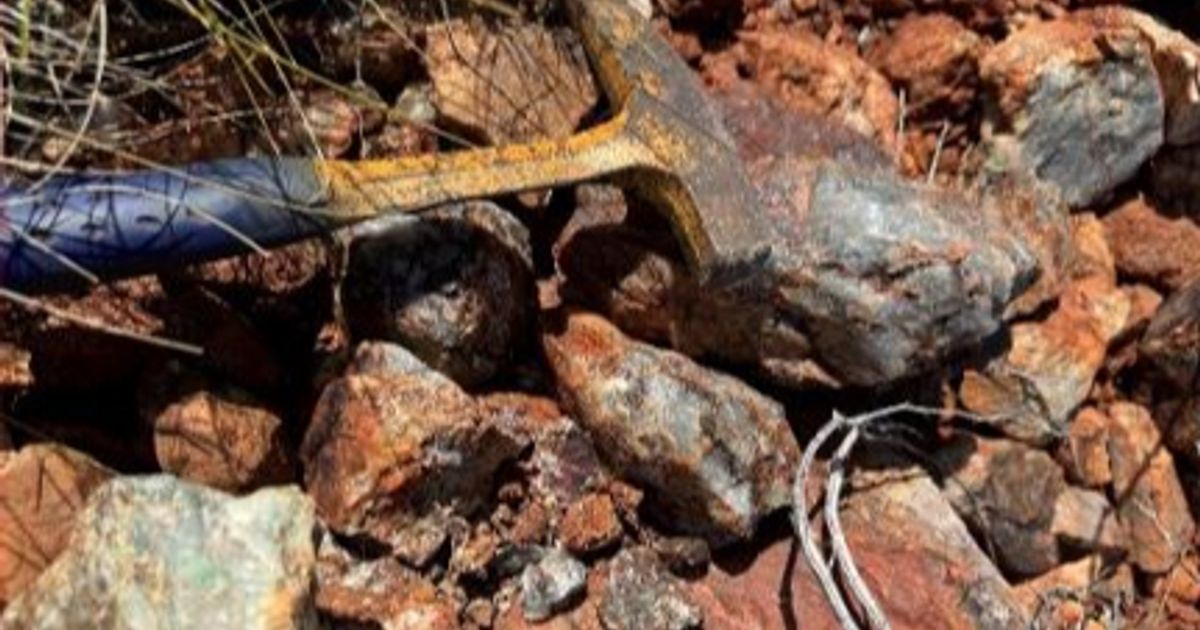
Artemis Resources unearths rock chips up to 45.8 g/t gold and 10.3% copper at Thorpe prospect, Karratha Project
Artemis Resources up 80% as it pulls gold whopper from Titan

Artemis Resources expands gold exploration in West Pilbara amid favorable market conditions

Artemis Resources expands gold exploration in West Pilbara amid favorable market conditions
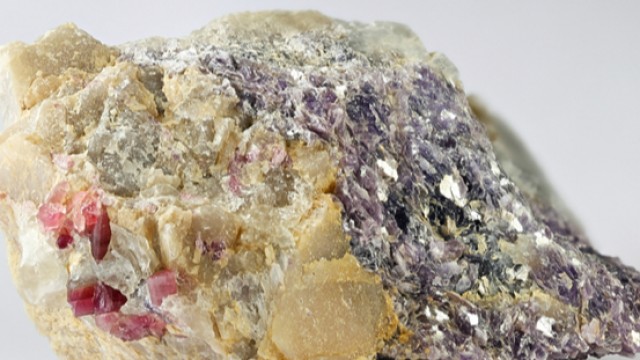
Artemis Resources climbs 17% on Mt Marie update

Artemis Resources shares set alight on exploration update
Artemis Resources confirms ‘significant' lithium mineralisation in West Pilbara
Artemis Resources increasing activity across portfolio
Source: https://incomestatements.info
Category: Stock Reports
