See more : New Residential Investment Corp. (NRZ-PA) Income Statement Analysis – Financial Results
Complete financial analysis of California Water Service Group (CWT) income statement, including revenue, profit margins, EPS and key performance metrics. Get detailed insights into the financial performance of California Water Service Group, a leading company in the Regulated Water industry within the Utilities sector.
- China Construction Bank Corporation (CICHF) Income Statement Analysis – Financial Results
- Evonik Industries AG (EVK.DE) Income Statement Analysis – Financial Results
- Tokyo Rope Mfg. Co., Ltd. (5981.T) Income Statement Analysis – Financial Results
- Celon Pharma S.A. (CLN.WA) Income Statement Analysis – Financial Results
- Chennai Petroleum Corporation Limited (CHENNPETRO.NS) Income Statement Analysis – Financial Results
California Water Service Group (CWT)
About California Water Service Group
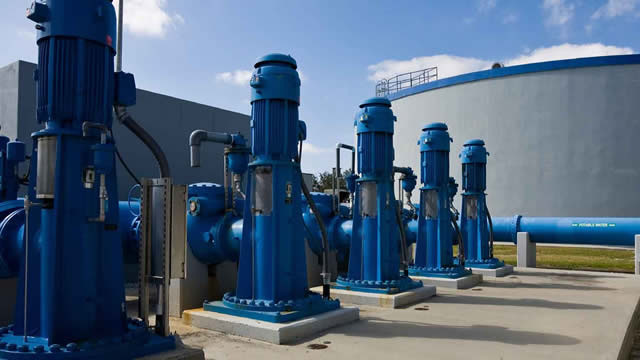
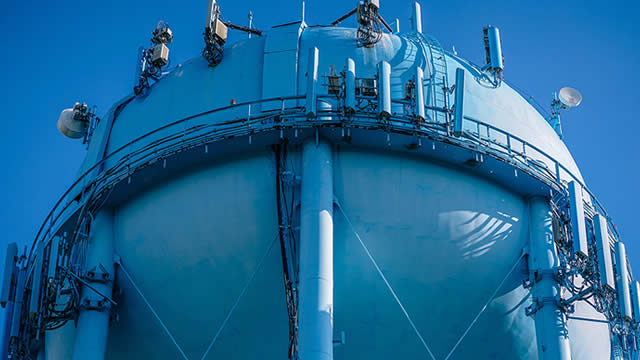
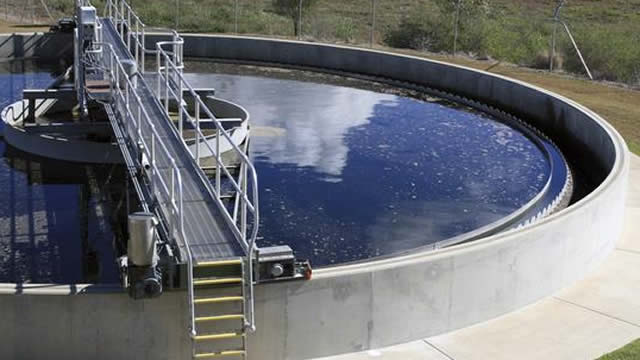
California Water Service Group, through its subsidiaries, provides water utility and other related services in California, Washington, New Mexico, Hawaii, and Texas. The company is involved in the production, purchase, storage, treatment, testing, distribution, and sale of water for domestic, industrial, public, and irrigation uses, as well as for fire protection. It offers its services to approximately 494,500 customer connections in 100 California communities; approximately 6,200 water and wastewater customer connections on the islands of Maui and Hawaii; approximately 36,400 customer connections in the Tacoma, Olympia, Graham, Spanaway, Puyallup, and Gig Harbor areas; and approximately 8,600 water and wastewater customer connections in the Belen, Los Lunas, Indian Hills, and Elephant Butte areas in New Mexico. The company also engages in the provision of non-regulated water-related services, including operating of municipally owned water systems, privately owned water, and recycled water distribution systems; water system operation, meter reading, and billing services to private companies and municipalities; leasing of communication antenna sites on its properties to telecommunication companies; and billing of optional third-party insurance programs to its residential customers, as well as provides lab services. In addition, it offers wastewater collection and treatment services. The company was founded in 1926 and is headquartered in San Jose, California.
| Metric | 2023 | 2022 | 2021 | 2020 | 2019 | 2018 | 2017 | 2016 | 2015 | 2014 | 2013 | 2012 | 2011 | 2010 | 2009 | 2008 | 2007 | 2006 | 2005 | 2004 | 2003 | 2002 | 2001 | 2000 | 1999 | 1998 | 1997 | 1996 | 1995 | 1994 | 1993 | 1992 | 1991 | 1990 | 1989 | 1988 | 1987 | 1986 | 1985 |
|---|---|---|---|---|---|---|---|---|---|---|---|---|---|---|---|---|---|---|---|---|---|---|---|---|---|---|---|---|---|---|---|---|---|---|---|---|---|---|---|
| Revenue | 794.63M | 846.43M | 790.91M | 794.31M | 714.56M | 698.20M | 666.89M | 609.37M | 588.37M | 597.50M | 584.10M | 559.97M | 501.81M | 460.40M | 449.37M | 410.31M | 367.08M | 334.72M | 320.73M | 315.57M | 277.13M | 263.15M | 246.82M | 244.81M | 206.40M | 186.30M | 195.30M | 182.80M | 165.10M | 157.30M | 151.70M | 139.80M | 127.20M | 124.40M | 117.50M | 113.80M | 112.80M | 109.50M | 104.60M |
| Cost of Revenue | 431.26M | 316.98M | 307.07M | 304.76M | 282.18M | 277.34M | 264.40M | 242.99M | 229.39M | 243.80M | 243.43M | 221.84M | 181.75M | 164.11M | 216.06M | 137.67M | 130.72M | 116.16M | 20.54M | 21.80M | 21.92M | 22.90M | 21.13M | 15.14M | 13.00M | 11.10M | 12.50M | 12.10M | 12.70M | 12.60M | 0.00 | 0.00 | 0.00 | 0.00 | 0.00 | 0.00 | 0.00 | 0.00 | 0.00 |
| Gross Profit | 363.38M | 529.45M | 483.84M | 489.55M | 432.38M | 420.86M | 402.49M | 366.38M | 358.98M | 353.70M | 340.67M | 338.13M | 320.06M | 296.29M | 233.31M | 272.65M | 236.36M | 218.55M | 300.19M | 293.77M | 255.21M | 240.25M | 225.69M | 229.67M | 193.40M | 175.20M | 182.80M | 170.70M | 152.40M | 144.70M | 151.70M | 139.80M | 127.20M | 124.40M | 117.50M | 113.80M | 112.80M | 109.50M | 104.60M |
| Gross Profit Ratio | 45.73% | 62.55% | 61.18% | 61.63% | 60.51% | 60.28% | 60.35% | 60.13% | 61.01% | 59.20% | 58.32% | 60.38% | 63.78% | 64.36% | 51.92% | 66.45% | 64.39% | 65.29% | 93.60% | 93.09% | 92.09% | 91.30% | 91.44% | 93.82% | 93.70% | 94.04% | 93.60% | 93.38% | 92.31% | 91.99% | 100.00% | 100.00% | 100.00% | 100.00% | 100.00% | 100.00% | 100.00% | 100.00% | 100.00% |
| Research & Development | 0.00 | 0.00 | 0.00 | 0.00 | 0.00 | 0.00 | 0.00 | 0.00 | 0.00 | 0.00 | 0.00 | 0.00 | 0.00 | 0.00 | 0.00 | 0.00 | 0.00 | 0.00 | 0.00 | 0.00 | 0.00 | 0.00 | 0.00 | 0.00 | 0.00 | 0.00 | 0.00 | 0.00 | 0.00 | 0.00 | 0.00 | 0.00 | 0.00 | 0.00 | 0.00 | 0.00 | 0.00 | 0.00 | 0.00 |
| General & Administrative | 142.24M | 132.72M | 126.69M | 117.06M | 108.62M | 100.78M | 102.91M | 98.47M | 113.11M | 97.37M | 98.06M | 93.93M | 85.76M | 75.28M | 75.24M | 59.43M | 54.26M | 52.79M | 0.00 | 0.00 | 0.00 | 0.00 | 0.00 | 0.00 | 0.00 | 0.00 | 0.00 | 0.00 | 0.00 | 0.00 | 0.00 | 0.00 | 0.00 | 0.00 | 0.00 | 0.00 | 0.00 | 0.00 | 0.00 |
| Selling & Marketing | 0.00 | 0.00 | 0.00 | 0.00 | 0.00 | 0.00 | 0.00 | 0.00 | 0.00 | 0.00 | 0.00 | 0.00 | 0.00 | 0.00 | 0.00 | 0.00 | 0.00 | 0.00 | 0.00 | 0.00 | 0.00 | 0.00 | 0.00 | 0.00 | 0.00 | 0.00 | 0.00 | 0.00 | 0.00 | 0.00 | 0.00 | 0.00 | 0.00 | 0.00 | 0.00 | 0.00 | 0.00 | 0.00 | 0.00 |
| SG&A | 142.24M | 132.72M | 126.69M | 117.06M | 108.62M | 100.78M | 102.91M | 98.47M | 113.11M | 97.37M | 98.06M | 93.93M | 85.76M | 75.28M | 75.24M | 59.43M | 54.26M | 52.79M | 48.66M | 47.08M | 40.97M | 37.65M | 36.52M | 32.97M | 28.00M | 24.40M | 23.50M | 21.70M | 20.00M | 18.20M | 0.00 | 0.00 | 0.00 | 0.00 | 0.00 | 0.00 | 0.00 | 0.00 | 0.00 |
| Other Expenses | 144.01M | 265.81M | 227.58M | 224.39M | 208.07M | -13.77M | 6.51M | 4.99M | 1.90M | 3.08M | 3.53M | 5.13M | 167.14M | 102.69M | 99.95M | 131.24M | 120.04M | 110.16M | 191.72M | 188.12M | 171.11M | 159.74M | 154.29M | 151.93M | 122.60M | 110.20M | 111.10M | 106.50M | 97.20M | 91.40M | 0.00 | 0.00 | 0.00 | 0.00 | 0.00 | 0.00 | 0.00 | 0.00 | 0.00 |
| Operating Expenses | 286.24M | 398.53M | 354.27M | 341.45M | 316.69M | 291.73M | 278.94M | 265.39M | 263.30M | 245.13M | 247.62M | 244.93M | 252.89M | 234.48M | 175.19M | 190.67M | 174.30M | 162.95M | 240.37M | 235.20M | 212.08M | 197.39M | 190.81M | 184.90M | 150.60M | 134.60M | 134.60M | 128.20M | 117.20M | 109.60M | 0.00 | 0.00 | 0.00 | 0.00 | 0.00 | 0.00 | 0.00 | 0.00 | 0.00 |
| Cost & Expenses | 717.50M | 715.51M | 661.33M | 646.21M | 598.87M | 569.07M | 543.34M | 508.37M | 492.69M | 488.93M | 491.05M | 466.77M | 434.65M | 398.59M | 391.25M | 328.34M | 305.03M | 279.11M | 260.91M | 257.00M | 234.00M | 220.29M | 211.94M | 200.04M | 163.60M | 145.70M | 147.10M | 140.30M | 129.90M | 122.20M | 0.00 | 0.00 | 0.00 | 0.00 | 0.00 | 0.00 | 0.00 | 0.00 | 0.00 |
| Interest Income | 303.00K | 177.00K | 171.00K | 52.00K | 92.00K | 0.00 | 0.00 | 0.00 | 39.00K | 0.00 | 0.00 | 0.00 | 0.00 | 0.00 | 106.00K | 423.00K | 0.00 | 0.00 | 0.00 | 0.00 | 0.00 | 0.00 | 0.00 | 0.00 | 0.00 | 0.00 | 0.00 | 0.00 | 0.00 | 0.00 | 0.00 | 0.00 | 0.00 | 0.00 | 0.00 | 0.00 | 0.00 | 0.00 | 0.00 |
| Interest Expense | 49.82M | 44.34M | 43.21M | 41.86M | 41.22M | 37.85M | 33.93M | 30.50M | 27.27M | 26.95M | 28.86M | 28.14M | 29.71M | 26.37M | 21.31M | 17.18M | 17.13M | 16.97M | 17.70M | 17.84M | 17.52M | 16.84M | 16.03M | 14.65M | 0.00 | 12.40M | 0.00 | 11.90M | 11.50M | 11.40M | 0.00 | 0.00 | 0.00 | 0.00 | 0.00 | 0.00 | 0.00 | 0.00 | 0.00 |
| Depreciation & Amortization | 123.12M | 117.36M | 111.58M | 100.94M | 91.29M | 85.71M | 78.59M | 65.20M | 61.38M | 61.22M | 58.32M | 54.67M | 51.98M | 42.83M | 39.78M | 39.49M | 34.24M | 30.65M | 28.73M | 26.11M | 23.26M | 21.24M | 19.23M | 18.37M | 13.30M | 13.80M | 12.80M | 12.10M | 10.60M | 10.70M | 0.00 | 0.00 | 0.00 | 0.00 | 0.00 | 0.00 | 0.00 | 0.00 | 0.00 |
| EBITDA | 217.54M | 262.72M | 250.83M | 244.00M | 201.21M | 205.39M | 211.18M | 169.22M | 158.66M | 171.69M | 153.06M | 155.28M | 142.57M | 133.85M | 97.90M | 94.81M | 96.29M | 86.26M | 83.43M | 82.30M | 66.39M | 64.10M | 54.11M | 63.14M | 56.10M | 59.42M | 61.00M | 54.60M | 45.80M | 45.80M | 151.70M | 139.80M | 127.20M | 124.40M | 117.50M | 113.80M | 112.80M | 109.50M | 104.60M |
| EBITDA Ratio | 27.38% | 30.30% | 32.09% | 30.75% | 28.63% | 28.52% | 31.29% | 27.83% | 27.02% | 28.93% | 26.52% | 27.32% | 23.69% | 22.25% | 20.95% | 29.81% | 25.11% | 25.10% | 26.01% | 26.08% | 21.54% | 22.23% | 19.55% | 25.21% | 27.18% | 29.20% | 31.23% | 29.87% | 27.74% | 29.12% | 100.00% | 100.00% | 100.00% | 100.00% | 100.00% | 100.00% | 100.00% | 100.00% | 100.00% |
| Operating Income | 77.14M | 127.66M | 126.17M | 136.67M | 99.41M | 110.54M | 94.62M | 76.19M | 71.15M | 81.85M | 74.01M | 73.84M | 67.17M | 61.81M | 58.12M | 81.98M | 62.06M | 55.60M | 59.82M | 58.57M | 43.13M | 42.87M | 34.88M | 44.77M | 42.80M | 40.60M | 48.20M | 42.50M | 35.20M | 35.10M | 151.70M | 139.80M | 127.20M | 124.40M | 117.50M | 113.80M | 112.80M | 109.50M | 104.60M |
| Operating Income Ratio | 9.71% | 15.08% | 15.95% | 17.21% | 13.91% | 15.83% | 14.19% | 12.50% | 12.09% | 13.70% | 12.67% | 13.19% | 13.38% | 13.43% | 12.93% | 19.98% | 16.91% | 16.61% | 18.65% | 18.56% | 15.56% | 16.29% | 14.13% | 18.29% | 20.74% | 21.79% | 24.68% | 23.25% | 21.32% | 22.31% | 100.00% | 100.00% | 100.00% | 100.00% | 100.00% | 100.00% | 100.00% | 100.00% | 100.00% |
| Total Other Income/Expenses | -32.54M | -26.02M | -21.70M | -27.82M | -18.63M | -29.08M | 2.68M | -7.15M | -847.00K | 2.86M | -6.28M | -3.56M | -6.29M | -24.16M | -17.57M | -18.04M | -13.01M | -14.73M | -12.59M | -15.46M | -10.82M | -11.22M | -10.19M | -13.23M | -7.31M | -9.32M | -11.00M | -11.20M | -10.60M | -11.10M | -151.70M | -139.80M | -127.20M | -124.40M | -117.50M | -113.80M | -112.80M | -109.50M | -104.60M |
| Income Before Tax | 44.60M | 101.64M | 105.07M | 108.85M | 80.79M | 81.46M | 100.54M | 75.49M | 70.31M | 84.71M | 67.72M | 70.28M | 37.71M | 37.66M | 40.55M | 63.94M | 49.05M | 40.88M | 47.23M | 43.11M | 32.32M | 31.64M | 24.69M | 31.53M | 32.10M | 29.00M | 37.30M | 31.30M | 24.60M | 24.00M | 0.00 | 0.00 | 0.00 | 0.00 | 0.00 | 0.00 | 0.00 | 0.00 | 0.00 |
| Income Before Tax Ratio | 5.61% | 12.01% | 13.28% | 13.70% | 11.31% | 11.67% | 15.08% | 12.39% | 11.95% | 14.18% | 11.59% | 12.55% | 7.52% | 8.18% | 9.02% | 15.58% | 13.36% | 12.21% | 14.73% | 13.66% | 11.66% | 12.02% | 10.00% | 12.88% | 15.55% | 15.57% | 19.10% | 17.12% | 14.90% | 15.26% | 0.00% | 0.00% | 0.00% | 0.00% | 0.00% | 0.00% | 0.00% | 0.00% | 0.00% |
| Income Tax Expense | -6.78M | 6.38M | 4.09M | 12.02M | 17.67M | 15.87M | 33.36M | 26.82M | 25.29M | 27.97M | 20.47M | 21.45M | 29.46M | 24.16M | 17.57M | 24.13M | 17.89M | 15.30M | 20.01M | 17.08M | 12.90M | 12.57M | 9.73M | 11.57M | 12.20M | 10.60M | 14.00M | 12.20M | 9.90M | 9.60M | -15.50M | -12.50M | -13.90M | -14.40M | -13.80M | -14.10M | -15.00M | -13.70M | -12.50M |
| Net Income | 51.91M | 96.01M | 101.13M | 96.83M | 63.12M | 65.58M | 67.18M | 48.68M | 45.02M | 56.74M | 47.25M | 48.83M | 37.71M | 37.66M | 40.55M | 39.81M | 31.16M | 25.58M | 27.22M | 26.03M | 19.42M | 19.07M | 14.97M | 19.96M | 19.90M | 18.40M | 23.30M | 19.10M | 14.70M | 14.40M | 15.50M | 12.50M | 13.90M | 14.40M | 13.80M | 14.10M | 15.00M | 13.70M | 12.50M |
| Net Income Ratio | 6.53% | 11.34% | 12.79% | 12.19% | 8.83% | 9.39% | 10.07% | 7.99% | 7.65% | 9.50% | 8.09% | 8.72% | 7.52% | 8.18% | 9.02% | 9.70% | 8.49% | 7.64% | 8.49% | 8.25% | 7.01% | 7.25% | 6.06% | 8.15% | 9.64% | 9.88% | 11.93% | 10.45% | 8.90% | 9.15% | 10.22% | 8.94% | 10.93% | 11.58% | 11.74% | 12.39% | 13.30% | 12.51% | 11.95% |
| EPS | 0.91 | 1.77 | 1.96 | 1.97 | 1.31 | 1.36 | 1.52 | 1.02 | 0.94 | 1.19 | 1.02 | 1.17 | 0.90 | 0.90 | 0.98 | 0.95 | 0.75 | 0.67 | 0.74 | 0.70 | 0.57 | 0.63 | 0.49 | 0.66 | 0.73 | 0.78 | 0.92 | 0.75 | 0.58 | 0.61 | 0.68 | 0.55 | 0.61 | 0.63 | 0.60 | 0.61 | 0.66 | 0.61 | 0.56 |
| EPS Diluted | 0.91 | 1.77 | 1.96 | 1.97 | 1.31 | 1.36 | 1.52 | 1.01 | 0.94 | 1.19 | 1.02 | 1.17 | 0.90 | 0.90 | 0.98 | 0.95 | 0.75 | 0.67 | 0.74 | 0.70 | 0.57 | 0.63 | 0.49 | 0.66 | 0.72 | 0.66 | 0.92 | 0.75 | 0.58 | 0.61 | 0.68 | 0.55 | 0.61 | 0.63 | 0.60 | 0.61 | 0.66 | 0.61 | 0.56 |
| Weighted Avg Shares Out | 56.95M | 54.32M | 51.63M | 49.27M | 48.17M | 48.06M | 48.01M | 47.95M | 47.87M | 47.79M | 46.38M | 41.89M | 41.76M | 41.61M | 41.49M | 41.42M | 41.33M | 37.81M | 36.76M | 34.84M | 31.06M | 30.36M | 30.36M | 30.25M | 30.18M | 25.36M | 25.57M | 25.20M | 25.00M | 23.28M | 22.67M | 22.57M | 22.64M | 22.72M | 22.83M | 22.79M | 22.12M | 21.98M | 22.52M |
| Weighted Avg Shares Out (Dil) | 56.98M | 54.36M | 51.63M | 49.27M | 48.17M | 48.06M | 48.01M | 47.96M | 47.88M | 47.83M | 46.42M | 41.89M | 41.77M | 41.64M | 41.53M | 41.47M | 41.38M | 37.85M | 36.80M | 35.44M | 31.84M | 30.37M | 30.37M | 30.26M | 30.28M | 30.02M | 25.57M | 25.20M | 25.00M | 23.28M | 22.67M | 22.57M | 22.64M | 22.72M | 22.83M | 22.79M | 22.12M | 21.98M | 22.52M |

California Water Unit Hawaii Water to Acquire KSSCS Wastewater System

California Water Service Group Completes Purchase of Kukui'ula South Shore Community Services' Wastewater System

California Water Service Group Named One of “America's Most Responsible Companies” by Newsweek for Fourth Consecutive Year

California Water Leaders Heading to Palm Desert for ACWA Fall Conference

California Water Service Group (CWT) Q3 2024 Earnings Call Transcript

California Water Q3 Earnings Miss Estimates, Revenues Rise Y/Y

California Water Service Group (CWT) Lags Q3 Earnings Estimates

California Water Service Group Reports Third Quarter Results

California Water Service Group Board of Directors Declares 319th Consecutive Quarterly Dividend

NAACP Butte County Chapter Recognizes Cal Water with Award for Commitment to Supporting Oroville, Chico Communities
Source: https://incomestatements.info
Category: Stock Reports
