See more : Jiangsu Leili Motor Co., Ltd (300660.SZ) Income Statement Analysis – Financial Results
Complete financial analysis of Spartan Delta Corp. (DALXF) income statement, including revenue, profit margins, EPS and key performance metrics. Get detailed insights into the financial performance of Spartan Delta Corp., a leading company in the Oil & Gas Exploration & Production industry within the Energy sector.
- Kikusui Holdings Corporation (6912.T) Income Statement Analysis – Financial Results
- Japan Excellent, Inc. (8987.T) Income Statement Analysis – Financial Results
- Xiamen Kingdomway Group Company (002626.SZ) Income Statement Analysis – Financial Results
- TPG Pace Tech Opportunities Corp. (PACE-UN) Income Statement Analysis – Financial Results
- CatchMark Timber Trust, Inc. (CTT) Income Statement Analysis – Financial Results
Spartan Delta Corp. (DALXF)
About Spartan Delta Corp.
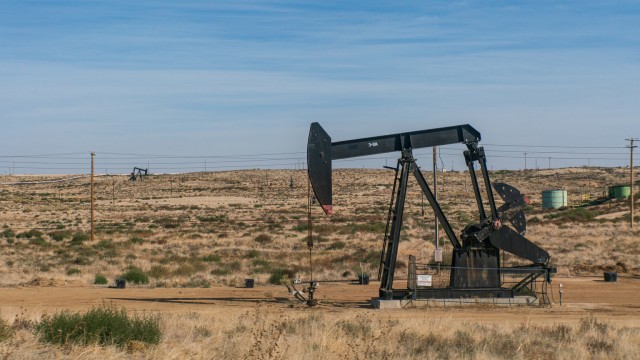
Spartan Delta Corp. engages in the exploration, development, and production of petroleum and natural gas properties in the Western Canada. It also owns and operates oil and gas properties in Alberta, Saskatchewan, and British Columbia. As of December 31, 2021, company owned total proved plus probable reserves of 545,734 thousand barrels of oil equivalent. The company was formerly known as Return Energy Inc. and changed its name to Spartan Delta Corp. in May 2020. Spartan Delta Corp. was incorporated in 2006 and is headquartered in Calgary, Canada.
| Metric | 2023 | 2022 | 2021 | 2020 | 2019 | 2018 | 2017 | 2016 | 2015 | 2014 | 2013 | 2012 | 2011 | 2010 | 2009 | 2008 | 2007 | 2006 |
|---|---|---|---|---|---|---|---|---|---|---|---|---|---|---|---|---|---|---|
| Revenue | 592.80M | 1.48B | 618.84M | 99.71M | 1.65M | 2.03M | 2.24M | 529.37K | 38.73K | 1.03M | 2.59M | 2.43M | 3.13M | 3.05M | 1.74M | 3.47M | 302.42K | 277.30K |
| Cost of Revenue | 183.18M | 371.01M | 169.53M | 36.01M | 2.29M | 1.68M | 1.22M | 207.81K | 10.87K | 406.70K | 1.40M | 1.06M | 1.33M | 1.01M | 631.22K | 240.25K | 14.82K | 0.00 |
| Gross Profit | 409.61M | 1.10B | 449.31M | 63.70M | -643.24K | 353.05K | 1.02M | 321.56K | 27.86K | 621.72K | 1.19M | 1.37M | 1.79M | 2.04M | 1.11M | 3.23M | 287.61K | 277.30K |
| Gross Profit Ratio | 69.10% | 74.85% | 72.61% | 63.89% | -39.00% | 17.36% | 45.47% | 60.74% | 71.93% | 60.45% | 45.96% | 56.37% | 57.35% | 66.85% | 63.71% | 93.08% | 95.10% | 100.00% |
| Research & Development | 0.00 | 0.00 | 0.00 | 0.00 | 0.00 | 0.00 | 0.00 | 0.00 | 0.00 | 0.00 | 0.00 | 0.00 | 0.00 | 0.00 | 0.00 | 0.00 | 0.00 | 0.00 |
| General & Administrative | 20.18M | 112.48M | 62.34M | 18.48M | 1.24M | 1.68M | 1.17M | 519.47K | 594.22K | 1.09M | 1.27M | 1.42M | 1.33M | 1.17M | 1.01M | 1.01M | 0.00 | 0.00 |
| Selling & Marketing | 50.88M | 0.00 | 0.00 | 0.00 | 0.00 | 0.00 | 0.00 | 0.00 | 0.00 | 0.00 | 0.00 | 0.00 | 0.00 | 0.00 | 0.00 | 0.00 | 0.00 | 0.00 |
| SG&A | 71.06M | 112.48M | 62.34M | 18.48M | 1.24M | 1.68M | 1.17M | 519.47K | 594.22K | 1.09M | 1.27M | 1.42M | 1.33M | 1.17M | 1.01M | 1.01M | 1.22M | 490.30K |
| Other Expenses | 0.00 | 20.31M | 7.25M | 203.00K | 2.00M | -150.00K | -130.49K | 0.00 | 0.00 | 0.00 | 0.00 | 0.00 | 0.00 | -112.75K | -340.35K | 448.87K | 0.00 | 0.00 |
| Operating Expenses | 71.06M | 349.25M | 179.67M | 66.77M | 3.38M | 3.86M | 3.79M | 1.04M | 634.86K | 1.66M | 2.04M | 2.02M | 1.89M | 3.13M | 10.61M | 10.08M | 1.28M | 496.65K |
| Cost & Expenses | 254.24M | 720.26M | 349.19M | 102.78M | 5.68M | 5.54M | 5.01M | 1.25M | 645.73K | 2.07M | 3.44M | 3.08M | 3.23M | 4.14M | 11.24M | 10.32M | 1.29M | 496.65K |
| Interest Income | 23.72M | 741.00K | 405.00K | 94.00K | 0.00 | 0.00 | 0.00 | 34.33K | 287.00 | 12.11K | 9.58K | 20.05K | 28.84K | 2.45K | 20.80K | 164.21K | 0.00 | 0.00 |
| Interest Expense | 40.00M | 28.83M | 13.59M | 3.01M | 0.00 | 0.00 | 0.00 | 0.00 | 0.00 | 0.00 | 0.00 | 0.00 | 0.00 | 0.00 | 345.76K | 0.00 | 0.00 | 0.00 |
| Depreciation & Amortization | 148.67M | 214.64M | 105.20M | 27.84M | 1.56M | 1.83M | 1.18M | 192.49K | 7.41K | 221.05K | 884.64K | 671.74K | 573.52K | 1.96M | 9.60M | 8.22M | 60.49K | 6.34K |
| EBITDA | 362.29M | 943.02M | 380.19M | 24.37M | -1.76M | -1.68M | -1.62M | -503.14K | -497.21K | -897.35K | 33.12K | 17.93K | 434.28K | 755.48K | 853.44K | 787.52K | -930.58K | -213.00K |
| EBITDA Ratio | 61.12% | 66.91% | 61.44% | 24.44% | -106.84% | -107.16% | -95.16% | -107.93% | -1,349.74% | 399.31% | 52.20% | -1.52% | 14.24% | 24.78% | -14.20% | 22.68% | -307.71% | -76.81% |
| Operating Income | 338.56M | 775.93M | 277.30M | -2.77M | -4.05M | -3.86M | -3.18M | -752.66K | -530.12K | 3.89M | 467.17K | -708.60K | -127.90K | -1.21M | -9.84M | -7.44M | -991.07K | -219.35K |
| Operating Income Ratio | 57.11% | 52.60% | 44.81% | -2.77% | -245.85% | -189.80% | -141.97% | -142.18% | -1,368.87% | 377.81% | 18.04% | -29.21% | -4.09% | -39.63% | -565.88% | -214.20% | -327.71% | -79.10% |
| Total Other Income/Expenses | 412.74M | -250.82M | -14.86M | 4.15M | -377.00K | 352.06K | 411.11K | 33.87K | -3.75K | -4.87M | -1.31M | 74.84K | 54.95K | -3.05M | 414.26K | 1.04M | -168.71K | 46.42K |
| Income Before Tax | 751.30M | 710.03M | 356.53M | 41.04M | -2.00M | -3.16M | -2.36M | -650.59K | -683.59K | -5.96M | -2.16M | -578.98K | -72.95K | -1.21M | -9.09M | -5.81M | -1.16M | -172.92K |
| Income Before Tax Ratio | 126.74% | 48.13% | 57.61% | 41.16% | -121.14% | -155.18% | -105.25% | -122.90% | -1,765.15% | -579.38% | -83.43% | -23.87% | -2.33% | -39.63% | -522.49% | -167.21% | -383.50% | -62.36% |
| Income Tax Expense | 88.19M | 28.94M | 22.31M | -6.63M | -28.27K | -352.06K | -108.00K | -327.47K | 74.32K | 42.33K | 58.15K | 62.84K | 46.30K | 49.64K | 6.73K | 27.35K | 17.60K | 16.74K |
| Net Income | 663.11M | 681.09M | 334.22M | 47.66M | -2.00M | -3.16M | -2.25M | -391.32K | -681.32K | -6.00M | -2.22M | -448.60K | -119.25K | -2.80M | -9.09M | -5.83M | -1.18M | -189.66K |
| Net Income Ratio | 111.86% | 46.17% | 54.01% | 47.80% | -121.14% | -155.18% | -100.43% | -73.92% | -1,759.29% | -583.50% | -85.67% | -18.50% | -3.81% | -91.81% | -522.88% | -167.99% | -389.32% | -68.40% |
| EPS | 3.82 | 4.36 | 2.89 | 1.06 | -1.00 | -2.85 | -5.63 | -2.77 | -5.97 | -53.61 | -22.80 | -5.22 | -1.39 | -32.62 | -130.00 | -90.00 | -18.18 | -4.31 |
| EPS Diluted | 3.82 | 3.88 | 2.50 | 0.86 | -1.00 | -2.85 | -5.63 | -2.77 | -5.97 | -53.61 | -22.80 | -5.22 | -1.39 | -32.62 | -130.00 | -90.00 | -18.18 | -4.31 |
| Weighted Avg Shares Out | 173.59M | 156.14M | 115.56M | 44.85M | 2.00M | 1.11M | 399.70K | 141.17K | 114.04K | 111.94K | 97.30K | 85.86K | 85.82K | 85.82K | 69.96K | 64.81K | 64.77K | 44.04K |
| Weighted Avg Shares Out (Dil) | 173.49M | 175.48M | 133.46M | 55.40M | 2.00M | 1.11M | 399.70K | 141.17K | 114.04K | 111.94K | 97.30K | 85.86K | 85.82K | 85.82K | 69.96K | 64.81K | 64.77K | 44.04K |

Exchange Income Corporation Completes Acquisition of Spartan Mat, LLC and Spartan Composites, LLC

Spartan Delta: A Growth Thesis Proven By Actual Production

The New Spartan Delta Corp.

Logan Energy: Experienced Management Is The Big Advantage

Spartan Delta: Starting Over Again

Spartan Delta: One Of The Best Growth Stories You Probably Have Not Heard Of

Spartan Delta: FCF Positive In Current Gas Price Environment, Provides Excellent Torque

Spartan Delta: Evaluating The Deal

Spartan Delta: Payday Imminent After Closing C$1.7B Asset Sale

Small-Cap Energy Producers Ranked By Quality
Source: https://incomestatements.info
Category: Stock Reports
