See more : Zhejiang Shibao Company Limited (1057.HK) Income Statement Analysis – Financial Results
Complete financial analysis of Drax Group plc (DRXGF) income statement, including revenue, profit margins, EPS and key performance metrics. Get detailed insights into the financial performance of Drax Group plc, a leading company in the Renewable Utilities industry within the Utilities sector.
- BCPG Public Company Limited (BCPG-R.BK) Income Statement Analysis – Financial Results
- Harbor Custom Development, Inc. (HCDI) Income Statement Analysis – Financial Results
- The Connecticut Light and Power Company (CNLHN) Income Statement Analysis – Financial Results
- Sigma Solve Limited (SIGMA.BO) Income Statement Analysis – Financial Results
- GMO Financial Gate, Inc. (4051.T) Income Statement Analysis – Financial Results
Drax Group plc (DRXGF)
About Drax Group plc
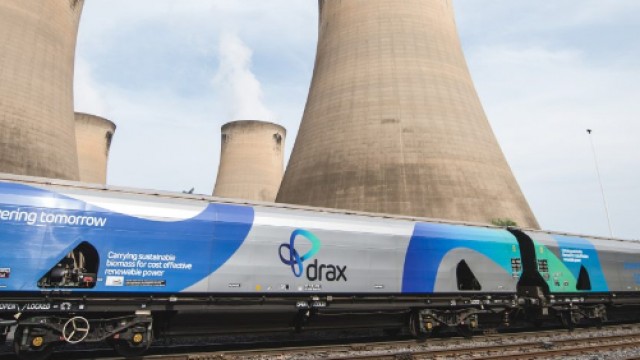
Drax Group plc, together with its subsidiaries, engages in renewable power generation in the United Kingdom. The company operates through three segments: Generation, Customers, and Pellet Production. The Generation segment provides renewable, dispatchable power, and system support services to the electricity grid. The Customers segment offers non-generation system support and energy management services. The Pellet Production segment provides low carbon fuel. The company owns and operates Drax Power Station with an installed capacity of 2,000 megawatts (MW) located in Selby, North Yorkshire; Cruachan Power Station, a pumped hydro storage station, with an installed capacity of 440 MW located in Argyll and Bute, and Lanark and Galloway hydro-electric power stations with an installed capacity of 126 MW located in southwest Scotland. In addition, the company owns and operates Daldowie fuel plant that processes sludge, a plant that converts it into dry low-odour fuel pellets. Further, it manufactures and sells compressed wood pellets; and supplies renewable electricity. Drax Group plc was incorporated in 2005 and is based in Selby, the United Kingdom.
| Metric | 2023 | 2022 | 2021 | 2020 | 2019 | 2018 | 2017 | 2016 | 2015 | 2014 | 2013 | 2012 | 2011 | 2010 | 2009 | 2008 | 2007 | 2006 | 2005 | 2004 | 2003 | 2002 |
|---|---|---|---|---|---|---|---|---|---|---|---|---|---|---|---|---|---|---|---|---|---|---|
| Revenue | 8.13B | 7.78B | 5.09B | 4.24B | 4.71B | 4.23B | 3.69B | 2.95B | 3.07B | 2.81B | 2.06B | 1.78B | 1.84B | 1.65B | 1.48B | 1.75B | 1.25B | 1.39B | 928.60M | 624.10M | 492.10M | 535.00M |
| Cost of Revenue | 6.35B | 6.75B | 4.20B | 3.52B | 3.98B | 3.59B | 3.14B | 2.57B | 2.66B | 2.36B | 1.62B | 1.27B | 1.34B | 1.10B | 972.90M | 1.13B | 546.10M | 641.30M | 539.50M | 384.70M | 0.00 | 0.00 |
| Gross Profit | 1.78B | 1.02B | 891.20M | 725.70M | 734.30M | 639.40M | 545.00M | 376.40M | 408.80M | 449.80M | 445.10M | 510.90M | 500.80M | 550.50M | 502.90M | 623.20M | 701.30M | 745.70M | 389.10M | 239.40M | 492.10M | 535.00M |
| Gross Profit Ratio | 21.90% | 13.16% | 17.52% | 17.10% | 15.58% | 15.12% | 14.79% | 12.76% | 13.34% | 16.04% | 21.58% | 28.71% | 27.28% | 33.40% | 34.08% | 35.55% | 56.22% | 53.76% | 41.90% | 38.36% | 100.00% | 100.00% |
| Research & Development | 22.80M | 12.50M | 11.40M | 11.50M | 2.70M | 0.00 | 0.00 | 0.00 | 0.00 | 0.00 | 0.00 | 0.00 | 0.00 | 0.00 | 0.00 | 0.00 | 0.00 | 0.00 | 0.00 | 0.00 | 0.00 | 0.00 |
| General & Administrative | 0.00 | 0.00 | 0.00 | 0.00 | 0.00 | 0.00 | 0.00 | 0.00 | 0.00 | 0.00 | 0.00 | 0.00 | 224.40M | 210.80M | 0.00 | 215.40M | 0.00 | 0.00 | 0.00 | 0.00 | 0.00 | 0.00 |
| Selling & Marketing | 0.00 | 0.00 | 0.00 | 0.00 | 0.00 | 0.00 | 0.00 | 0.00 | 0.00 | 0.00 | 0.00 | 0.00 | 0.00 | 0.00 | 0.00 | 0.00 | 0.00 | 0.00 | 0.00 | 0.00 | 0.00 | 0.00 |
| SG&A | 570.30M | 578.30M | 453.30M | 422.60M | 424.10M | 351.40M | 316.10M | 236.30M | 239.80M | 220.40M | 62.80M | 271.00M | 224.40M | 210.80M | 0.00 | 215.40M | 0.00 | 0.00 | 0.00 | 0.00 | 0.00 | 0.00 |
| Other Expenses | 278.40M | -5.80M | -9.40M | 0.00 | 3.10M | 4.10M | -400.00K | -900.00K | -1.10M | 0.00 | 0.00 | -1.00M | 0.00 | 60.50M | 129.70M | -56.30M | -3.30M | -90.80M | 117.00M | 0.00 | -74.10M | 0.00 |
| Operating Expenses | 871.50M | 782.20M | 669.30M | 592.50M | 647.20M | 493.80M | 482.40M | 345.80M | 340.20M | 321.10M | 279.90M | 271.00M | 404.00M | 89.80M | -59.40M | 328.00M | 246.00M | 379.20M | -297.60M | 184.40M | 404.90M | 381.20M |
| Cost & Expenses | 7.22B | 7.53B | 4.87B | 4.11B | 4.63B | 4.08B | 3.62B | 2.92B | 3.00B | 2.68B | 1.90B | 1.54B | 1.74B | 1.19B | 913.50M | 1.46B | 792.10M | 1.02B | 241.90M | 569.10M | 404.90M | 381.20M |
| Interest Income | 8.80M | 4.30M | 400.00K | 500.00K | 1.30M | 1.20M | 200.00K | 600.00K | 1.40M | 1.30M | 1.60M | 1.70M | 2.20M | 2.20M | 1.90M | 7.20M | 11.40M | 13.40M | 23.50M | 4.60M | 4.30M | 23.50M |
| Interest Expense | 110.80M | 83.50M | 64.70M | 58.50M | 55.50M | 37.20M | 26.30M | 23.90M | 18.70M | 29.90M | 24.80M | 15.30M | 30.30M | 26.50M | 17.30M | 28.80M | 34.30M | 37.10M | 114.40M | 101.20M | 99.70M | 105.70M |
| Depreciation & Amortization | 225.00M | 240.50M | 200.00M | 171.90M | 197.30M | 174.70M | 167.00M | 114.00M | 100.40M | 80.70M | 64.80M | 58.50M | 57.20M | 52.20M | 52.00M | 46.20M | 43.70M | 34.90M | 31.00M | 33.00M | 33.00M | 33.80M |
| EBITDA | 1.13B | 394.00M | 385.60M | 14.20M | 246.90M | 224.80M | 44.20M | 139.10M | 167.90M | 227.90M | 228.30M | 255.80M | 411.00M | 325.90M | 223.80M | 514.30M | 522.90M | 701.80M | 385.70M | 92.60M | 50.40M | -529.50M |
| EBITDA Ratio | 13.93% | 6.31% | 8.19% | 7.37% | 6.24% | 7.61% | 5.80% | 5.34% | 5.57% | 7.51% | 11.23% | 16.86% | 18.29% | 23.91% | 24.18% | 26.31% | 41.45% | 43.00% | 54.62% | 14.84% | 10.24% | 39.46% |
| Operating Income | 908.20M | 146.30M | 196.50M | -156.10M | 62.00M | 59.90M | -117.10M | 203.50M | 76.00M | 194.50M | 55.00M | 203.80M | 366.20M | 279.20M | 173.20M | 464.10M | 471.40M | 657.90M | 354.50M | 55.00M | -92.60M | -586.80M |
| Operating Income Ratio | 11.18% | 1.88% | 3.86% | -3.68% | 1.32% | 1.42% | -3.18% | 6.90% | 2.48% | 6.93% | 2.67% | 11.45% | 19.95% | 16.94% | 11.74% | 26.48% | 37.79% | 47.43% | 38.18% | 8.81% | -18.82% | -109.68% |
| Total Other Income/Expenses | -111.80M | -68.20M | -75.00M | -78.60M | -64.00M | -46.10M | -86.90M | -6.40M | -17.00M | -28.60M | -23.20M | -13.60M | -28.10M | -24.30M | -15.40M | -21.60M | -22.90M | -23.70M | -90.90M | -96.60M | -169.50M | -82.20M |
| Income Before Tax | 796.40M | 78.10M | 121.50M | -234.70M | -2.80M | 13.80M | -183.20M | 197.10M | 59.00M | 165.90M | 31.80M | 190.20M | 338.10M | 254.90M | 157.80M | 442.50M | 448.50M | 634.20M | 263.60M | -41.60M | -262.10M | -669.00M |
| Income Before Tax Ratio | 9.80% | 1.00% | 2.39% | -5.53% | -0.06% | 0.33% | -4.97% | 6.68% | 1.92% | 5.91% | 1.54% | 10.69% | 18.42% | 15.46% | 10.69% | 25.25% | 35.95% | 45.72% | 28.39% | -6.67% | -53.26% | -125.05% |
| Income Tax Expense | 235.50M | -4.40M | 66.40M | -40.10M | -3.30M | -6.40M | -32.10M | 3.20M | 2.70M | 37.20M | -19.60M | 26.40M | -126.50M | 66.50M | 46.90M | 109.60M | 95.50M | 170.70M | -18.80M | -35.10M | -13.00M | -14.40M |
| Net Income | 562.20M | 85.10M | 79.70M | -157.90M | 500.00K | 20.20M | -151.10M | 193.90M | 56.30M | 128.70M | 51.40M | 163.80M | 464.60M | 188.40M | 110.90M | 332.90M | 353.00M | 463.50M | 282.40M | -6.50M | -249.10M | -654.60M |
| Net Income Ratio | 6.92% | 1.09% | 1.57% | -3.72% | 0.01% | 0.48% | -4.10% | 6.57% | 1.84% | 4.59% | 2.49% | 9.20% | 25.31% | 11.43% | 7.51% | 18.99% | 28.30% | 33.42% | 30.41% | -1.04% | -50.62% | -122.36% |
| EPS | 1.40 | 0.21 | 0.20 | -0.40 | 0.00 | 0.05 | -0.37 | 0.48 | 0.14 | 0.32 | 0.13 | 0.44 | 1.26 | 0.52 | 0.31 | 0.98 | 0.99 | 1.21 | 1.25 | -0.03 | -0.71 | -1.86 |
| EPS Diluted | 1.39 | 0.21 | 0.19 | -0.40 | 0.00 | 0.05 | -0.37 | 0.47 | 0.14 | 0.32 | 0.13 | 0.44 | 1.26 | 0.52 | 0.31 | 0.98 | 0.99 | 1.21 | 1.25 | -0.03 | -0.71 | -1.86 |
| Weighted Avg Shares Out | 403.01M | 400.40M | 398.40M | 396.80M | 395.50M | 402.40M | 406.80M | 406.60M | 406.00M | 404.40M | 402.30M | 375.20M | 367.50M | 365.60M | 352.70M | 339.60M | 355.00M | 382.19M | 226.11M | 238.23M | 352.27M | 352.27M |
| Weighted Avg Shares Out (Dil) | 403.10M | 414.40M | 412.60M | 396.80M | 397.40M | 406.90M | 410.30M | 409.30M | 407.30M | 407.30M | 406.90M | 375.20M | 367.50M | 365.60M | 352.70M | 339.60M | 355.00M | 382.19M | 226.11M | 238.23M | 352.27M | 352.27M |

Drax Group plc (DRXGF) Full Year 2023 Results Earnings Call Transcript
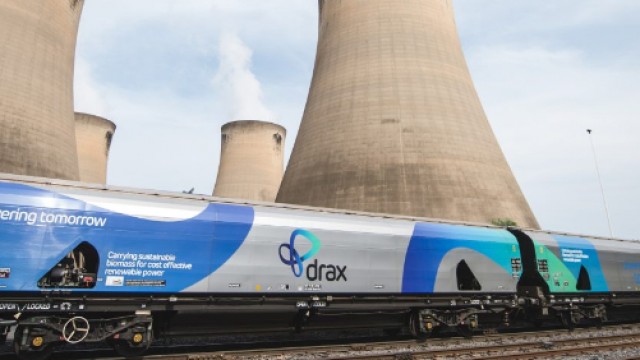
Drax Group shares up 6% on the back of a 'solid' set of prelims

Drax posts 66% jump in annual profit, raises dividend
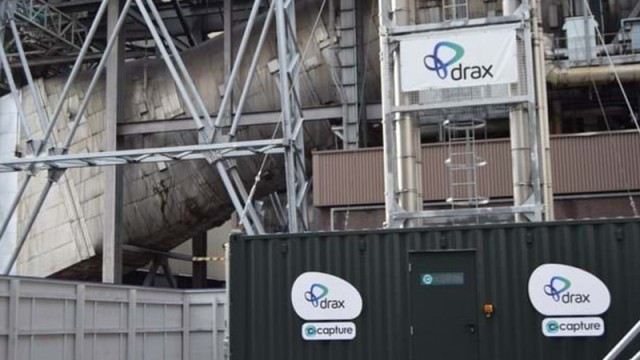
Ex-Rolls-Royce boss East joins carbon capture startup working with Drax Group
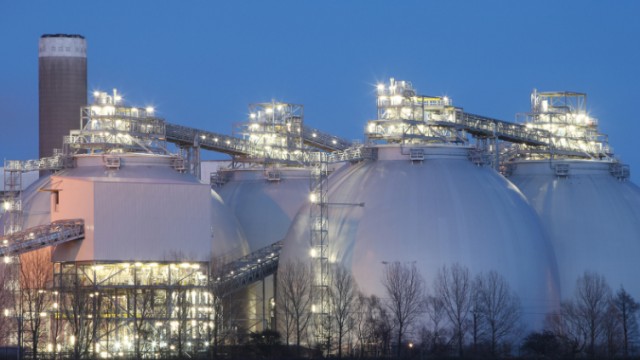
Drax, Vistry and Nokia among 110 European companies at largest discounts to US peers

Drax Group plc (DRXGF) Q2 2023 Earnings Call Transcript

Could Drax Group be the world's largest carbon removal companies, asks Barclays?

Drax US projects ‘highly attractive' – broker
Drax 'confident' in biomass reporting as Ofgem opens investigation
Drax gets another buy recommendation, this time from Jefferies
Source: https://incomestatements.info
Category: Stock Reports
