See more : Cannasouth Limited (CBD.NZ) Income Statement Analysis – Financial Results
Complete financial analysis of Enbridge Inc. 6.375 SNT18 B 78 (ENBA) income statement, including revenue, profit margins, EPS and key performance metrics. Get detailed insights into the financial performance of Enbridge Inc. 6.375 SNT18 B 78, a leading company in the Oil & Gas Midstream industry within the Energy sector.
- Acer Medical Inc. (6857.TWO) Income Statement Analysis – Financial Results
- Assembly Biosciences, Inc. (ASMB) Income Statement Analysis – Financial Results
- Logistics Innovation Technologies Corp. (LITTU) Income Statement Analysis – Financial Results
- KUWAZAWA Holdings Corporation (8104.T) Income Statement Analysis – Financial Results
- Huizhou Speed Wireless Technology Co.,Ltd. (300322.SZ) Income Statement Analysis – Financial Results
Enbridge Inc. 6.375 SNT18 B 78 (ENBA)
Industry: Oil & Gas Midstream
Sector: Energy
| Metric | 2022 | 2021 | 2020 | 2019 | 2018 | 2017 |
|---|---|---|---|---|---|---|
| Revenue | 53.31B | 0.00 | 0.00 | 50.07B | 46.38B | 44.38B |
| Cost of Revenue | 0.00 | 0.00 | 0.00 | 0.00 | 0.00 | 0.00 |
| Gross Profit | 53.31B | 0.00 | 0.00 | 50.07B | 46.38B | 44.38B |
| Gross Profit Ratio | 100.00% | 0.00% | 0.00% | 100.00% | 100.00% | 100.00% |
| Research & Development | 0.00 | 0.00 | 0.00 | 0.00 | 0.00 | 0.00 |
| General & Administrative | 0.00 | 0.00 | 0.00 | 0.00 | 0.00 | 0.00 |
| Selling & Marketing | 0.00 | 0.00 | 0.00 | 0.00 | 0.00 | 0.00 |
| SG&A | 0.00 | 0.00 | 0.00 | 0.00 | 0.00 | 0.00 |
| Other Expenses | 48.13B | 0.00 | 0.00 | -41.81B | -41.56B | -42.81B |
| Operating Expenses | 48.13B | 0.00 | 0.00 | -41.81B | -41.56B | -42.81B |
| Cost & Expenses | 48.13B | 0.00 | 0.00 | -41.81B | -41.56B | -42.81B |
| Interest Income | 0.00 | 0.00 | 0.00 | 0.00 | 0.00 | 0.00 |
| Interest Expense | 3.18B | 0.00 | 0.00 | 0.00 | 0.00 | 0.00 |
| Depreciation & Amortization | 4.32B | 236.56K | 206.30K | 171.86K | 161.14K | 52.52K |
| EBITDA | 12.04B | 0.00 | 0.00 | 8.26B | 4.82B | 1.57B |
| EBITDA Ratio | 22.58% | 0.00% | 0.00% | 16.50% | 10.38% | 3.54% |
| Operating Income | 7.72B | 0.00 | 0.00 | 8.26B | 4.82B | 1.57B |
| Operating Income Ratio | 14.48% | 0.00% | 0.00% | 16.50% | 10.38% | 3.54% |
| Total Other Income/Expenses | -3.18B | 0.00 | 0.00 | 0.00 | 0.00 | 0.00 |
| Income Before Tax | 4.54B | 0.00 | 0.00 | 0.00 | 0.00 | 0.00 |
| Income Before Tax Ratio | 8.52% | 0.00% | 0.00% | 0.00% | 0.00% | 0.00% |
| Income Tax Expense | 1.60B | 0.00 | 0.00 | 0.00 | 0.00 | 0.00 |
| Net Income | 2.94B | 0.00 | 0.00 | 0.00 | 0.00 | 0.00 |
| Net Income Ratio | 5.51% | 0.00% | 0.00% | 0.00% | 0.00% | 0.00% |
| EPS | 1.79 | 0.00 | 0.00 | 2.64 | 1.46 | 1.66 |
| EPS Diluted | 1.79 | 0.00 | 0.00 | 2.63 | 1.46 | 1.65 |
| Weighted Avg Shares Out | 1.64B | 0.00 | 0.00 | 0.00 | 0.00 | 0.00 |
| Weighted Avg Shares Out (Dil) | 1.64B | 0.00 | 0.00 | 0.00 | 0.00 | 0.00 |

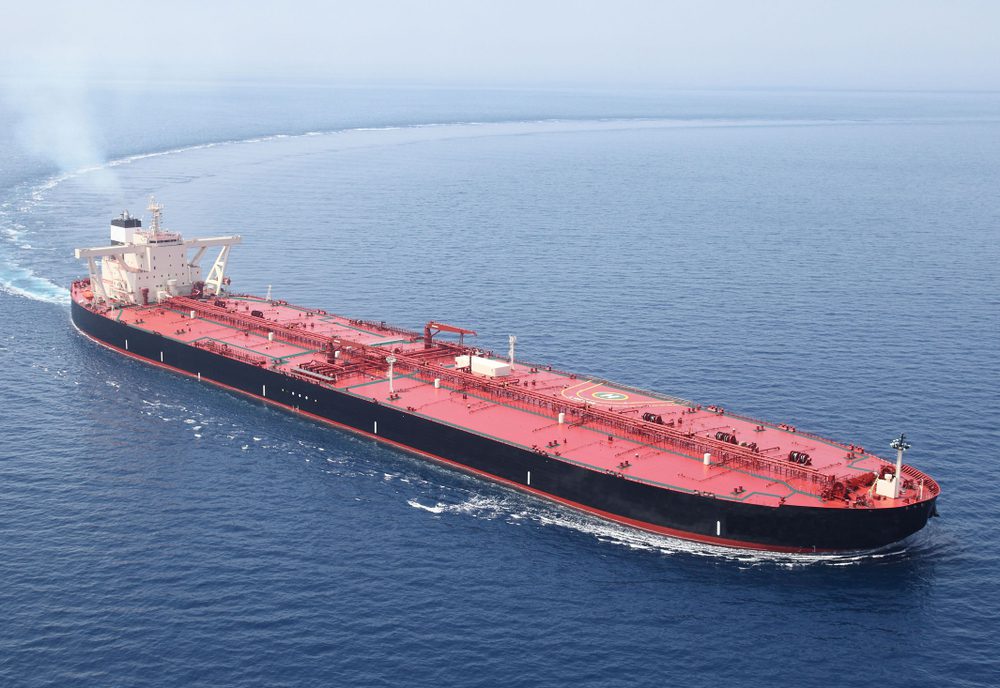
Enbridge, Enterprise to Develop Deepwater Crude Export Terminal in Gulf of Mexico – gCaptain

Enterprise and Enbridge Sign Letter of Intent to Jointly Develop Deepwater Terminal
Source: https://incomestatements.info
Category: Stock Reports
