Complete financial analysis of Generation Hemp, Inc. (GENH) income statement, including revenue, profit margins, EPS and key performance metrics. Get detailed insights into the financial performance of Generation Hemp, Inc., a leading company in the Drug Manufacturers – Specialty & Generic industry within the Healthcare sector.
- ChromoGenics AB (CHRO.ST) Income Statement Analysis – Financial Results
- Diablo Resources Limited (DBO.AX) Income Statement Analysis – Financial Results
- SG Corporation (004060.KS) Income Statement Analysis – Financial Results
- Biofil Chemicals and Pharmaceuticals Limited (BIOFILCHEM.NS) Income Statement Analysis – Financial Results
- DNA Brands, Inc. (DNAX) Income Statement Analysis – Financial Results
Generation Hemp, Inc. (GENH)
Industry: Drug Manufacturers - Specialty & Generic
Sector: Healthcare
Website: https://www.genhempinc.com
About Generation Hemp, Inc.
Generation Hemp, Inc. provide post-harvest and midstream services to growers by drying, processing, cleaning, and stripping harvested hemp directly from the field and wetbaled. It also owns and leases industrial warehouse in Denver. Generation Hemp, Inc. is based in Dallas, Texas.
| Metric | 2022 | 2021 | 2020 | 2019 | 2018 | 2017 | 2016 | 2015 | 2014 | 2013 | 2012 | 2011 | 2010 |
|---|---|---|---|---|---|---|---|---|---|---|---|---|---|
| Revenue | 2.60M | 674.52K | 90.00K | 7.50K | 558.15K | 412.40K | 452.06K | 390.74K | 189.39K | 180.49K | 28.03K | 0.00 | 0.00 |
| Cost of Revenue | 1.02M | 652.52K | 0.00 | 0.00 | 117.83K | 46.84K | 57.09K | 82.11K | 47.35K | 31.07K | 0.00 | 0.00 | 0.00 |
| Gross Profit | 1.58M | 22.00K | 90.00K | 7.50K | 440.33K | 365.55K | 394.97K | 308.63K | 142.04K | 149.43K | 28.03K | 0.00 | 0.00 |
| Gross Profit Ratio | 60.82% | 3.26% | 100.00% | 100.00% | 78.89% | 88.64% | 87.37% | 78.99% | 75.00% | 82.79% | 100.00% | 0.00% | 0.00% |
| Research & Development | 0.00 | 0.00 | 0.00 | 0.00 | 0.00 | 0.00 | 0.00 | 0.00 | 0.00 | 0.00 | 0.00 | 0.00 | 0.00 |
| General & Administrative | 7.13M | 7.79M | 1.14M | 997.35K | 406.54K | 350.86K | 354.80K | 260.06K | 274.00K | 153.91K | 64.94K | 27.97M | 24.46K |
| Selling & Marketing | 0.00 | 0.00 | 0.00 | 0.00 | 0.00 | 0.00 | 0.00 | 0.00 | 0.00 | 0.00 | 7.96K | -27.90M | 0.00 |
| SG&A | 7.13M | 7.79M | 1.14M | 997.35K | 406.54K | 350.86K | 354.80K | 260.06K | 274.00K | 153.91K | 72.90K | 64.05K | 24.46K |
| Other Expenses | 1.01M | 1.34M | 71.00K | 15.61K | 117.83K | 46.84M | 57.09M | 82.11M | 47.35M | 49.52M | 22.03M | 27.97M | 0.00 |
| Operating Expenses | 8.13M | 9.13M | 1.21M | 1.01M | 406.54K | 350.86K | 354.80K | 260.06K | 274.00K | 153.91K | 72.90K | 64.05K | 24.46K |
| Cost & Expenses | 9.15M | 9.78M | 1.21M | 1.01M | 524.37K | 397.70K | 411.89K | 342.17K | 321.35K | 184.97K | 72.90K | 64.05K | 24.46K |
| Interest Income | 0.00 | 25.42K | 1.00 | 2.70K | 0.00 | 0.00 | 0.00 | 0.00 | 0.00 | 0.00 | 0.00 | 0.00 | 0.00 |
| Interest Expense | 501.15K | 708.34K | 286.37K | 179.99K | 65.12K | 65.74K | 59.18K | 59.05K | 10.57K | 309.00 | 937.00 | 0.00 | 0.00 |
| Depreciation & Amortization | 1.51M | 1.37M | 170.88K | 5.73M | 21.99K | 22.65K | 23.84K | 26.03K | 8.38K | 0.00 | 0.00 | 0.00 | 0.00 |
| EBITDA | -5.05M | -8.45M | -1.05M | -7.10M | 61.80K | 51.90K | 40.17M | 48.57M | -131.99M | -4.48K | -44.87K | -64.05K | -24.46K |
| EBITDA Ratio | -194.52% | -1,147.42% | -1,168.84% | -13,162.03% | 11.07% | 12.59% | 14.16% | 19.09% | -63.64% | -2.48% | -160.11% | 0.00% | 0.00% |
| Operating Income | -6.55M | -9.11M | -1.22M | -6.72M | 33.78K | 14.70K | 40.17K | 48.57K | -131.96K | -4.48K | -44.87K | -64.05K | -24.46K |
| Operating Income Ratio | -252.54% | -1,349.92% | -1,358.71% | -89,625.05% | 6.05% | 3.56% | 8.89% | 12.43% | -69.67% | -2.48% | -160.11% | 0.00% | 0.00% |
| Total Other Income/Expenses | -407.24K | 0.00 | 0.00 | -792.73K | -59.09K | -51.18K | -40.19M | -48.58M | -7.53K | -309.00 | -45.77M | -128.10M | 0.00 |
| Income Before Tax | -6.96M | -9.79M | -1.52M | -7.12M | -25.31K | -36.49K | -19.01K | -10.48K | -139.48K | -4.79K | -45.81M | -64.05M | 0.00 |
| Income Before Tax Ratio | -268.23% | -1,451.80% | -1,687.88% | -94,882.80% | -4.53% | -8.85% | -4.20% | -2.68% | -73.65% | -2.65% | -163,449.53% | 0.00% | 0.00% |
| Income Tax Expense | -431.60K | 738.30K | 265.95K | 972.72K | 6.03K | 14.56K | 0.00 | 0.00 | 3.05K | 0.00 | -45.76M | -63.98M | 24.46K |
| Net Income | -6.53M | -10.53M | -1.79M | -8.09M | -25.31K | -36.49K | -19.01K | -10.48K | -139.48K | -4.79K | -45.81K | -64.05K | -24.46K |
| Net Income Ratio | -251.60% | -1,561.26% | -1,983.38% | -107,852.33% | -4.53% | -8.85% | -4.20% | -2.68% | -73.65% | -2.65% | -163.45% | 0.00% | 0.00% |
| EPS | -0.06 | -0.08 | -0.02 | -0.10 | 0.00 | 0.00 | 0.00 | 0.00 | -0.01 | 0.00 | 0.00 | -0.01 | 0.00 |
| EPS Diluted | -0.06 | -0.08 | -0.02 | -0.10 | 0.00 | 0.00 | 0.00 | 0.00 | -0.01 | 0.00 | 0.00 | -0.01 | 0.00 |
| Weighted Avg Shares Out | 0.00 | 125.13M | 108.00M | 79.31M | 13.21M | 13.21M | 13.21M | 13.21M | 12.74M | 11.73M | 11.58M | 11.42M | 11.37M |
| Weighted Avg Shares Out (Dil) | 0.00 | 125.13M | 108.00M | 79.31M | 13.21M | 13.21M | 13.21M | 13.21M | 12.74M | 11.73M | 11.58M | 11.42M | 11.37M |

Generation Hemp changes name to Evergreen Sustainable Enterprises from today

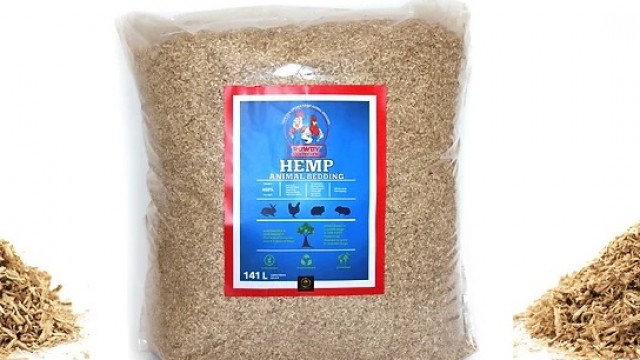
Generation Hemp sees its Rowdy Rooster Hemp animal bedding sales soar 385%

Generation Hemp to buy state-of-the-art Bitcoin miners for sustainable operations in Costa Rica

Generation Hemp announces name change, new strategic direction into sustainable energy projects

Generation Hemp posts record revenue in July by processing more hemp biomass and pre-selling some inventory

Generation Hemp launches Gas Monkey Spill-Jack hemp product line

Rowdy Rooster Hemp Unleashed | Official Launch of Generation Hemp's Animal Bedding Brand for Small Animals

Generation Hemp Announces Results of Certain Board of Directors Administrative Matters

Generation Hemp's Green Policy is Inspired by a Cause, Executives Move From Oil and Gas to Industrial Green
Source: https://incomestatements.info
Category: Stock Reports
