See more : Ashapura Minechem Limited (ASHAPURMIN.NS) Income Statement Analysis – Financial Results
Complete financial analysis of Headwater Gold Inc. (HWAUF) income statement, including revenue, profit margins, EPS and key performance metrics. Get detailed insights into the financial performance of Headwater Gold Inc., a leading company in the Gold industry within the Basic Materials sector.
- Main Street Capital Corporation (0JXQ.L) Income Statement Analysis – Financial Results
- SoftBank Group Corp. (SFTBY) Income Statement Analysis – Financial Results
- Panasonic Carbon India Co. Limited (PANCARBON.BO) Income Statement Analysis – Financial Results
- Pacific Ridge Exploration Ltd. (PEX.V) Income Statement Analysis – Financial Results
- Canterra Minerals Corporation (CTMCF) Income Statement Analysis – Financial Results
Headwater Gold Inc. (HWAUF)
About Headwater Gold Inc.
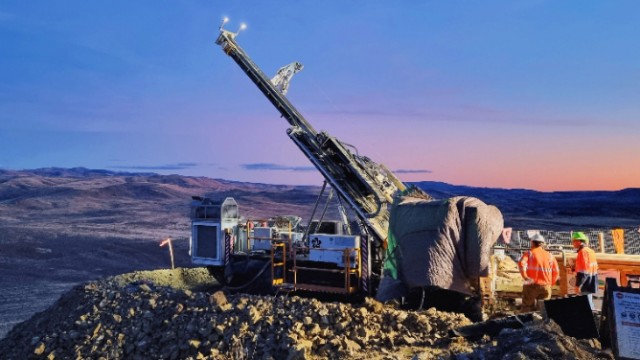
Headwater Gold Inc. engages in the acquisition and exploration of precious metal properties in the United States. The company primarily explores for gold. It holds interests in properties located in the states of Idaho, Nevada, Oregon, and Utah. The company was incorporated in 2019 and is based in Vancouver, Canada.
| Metric | 2024 | 2023 | 2022 | 2021 | 2020 | 2019 |
|---|---|---|---|---|---|---|
| Revenue | 0.00 | 0.00 | 0.00 | 0.00 | 0.00 | 0.00 |
| Cost of Revenue | 236.72K | 132.74K | 67.46K | 0.00 | 0.00 | 0.00 |
| Gross Profit | -236.72K | -132.74K | -67.46K | 0.00 | 0.00 | 0.00 |
| Gross Profit Ratio | 0.00% | 0.00% | 0.00% | 0.00% | 0.00% | 0.00% |
| Research & Development | 0.00 | 0.00 | 0.00 | 0.00 | 0.00 | 0.00 |
| General & Administrative | 0.00 | 1.10M | 1.20M | 556.95K | 251.41K | 0.00 |
| Selling & Marketing | 0.00 | 0.00 | 0.00 | 0.00 | 0.00 | 0.00 |
| SG&A | 1.35M | 1.10M | 1.20M | 556.95K | 251.41K | 4.90K |
| Other Expenses | 0.00 | 604.22K | 0.00 | 0.00 | 0.00 | 0.00 |
| Operating Expenses | 1.35M | 1.21M | 1.30M | 630.14K | 344.51K | 4.90K |
| Cost & Expenses | 1.59M | 1.34M | 1.37M | 630.14K | 344.51K | 4.90K |
| Interest Income | 87.61K | 18.54K | 7.97K | 2.78K | 997.00 | 0.00 |
| Interest Expense | 24.72K | 19.00K | 17.95K | 0.00 | 0.00 | 0.00 |
| Depreciation & Amortization | 236.72K | 132.74K | 67.46K | 67.46K | 206.30K | 171.86K |
| EBITDA | -1.35M | -583.04K | -1.29M | -627.35K | -272.91K | -4.90K |
| EBITDA Ratio | 0.00% | 0.00% | 0.00% | 0.00% | 0.00% | 0.00% |
| Operating Income | -1.59M | -715.79K | -1.36M | -2.86M | -272.91K | -4.90K |
| Operating Income Ratio | 0.00% | 0.00% | 0.00% | 0.00% | 0.00% | 0.00% |
| Total Other Income/Expenses | 1.80M | -317.79K | -1.91M | 2.23M | -142.21K | 2.00 |
| Income Before Tax | 210.68K | -1.03M | -3.27M | 1.60M | -415.12K | -4.90K |
| Income Before Tax Ratio | 0.00% | 0.00% | 0.00% | 0.00% | 0.00% | 0.00% |
| Income Tax Expense | 2.00 | 623.22K | -204.98K | 416.61K | -135.69K | -171.86K |
| Net Income | 210.68K | -1.03M | -3.06M | 1.19M | -415.12K | -4.90K |
| Net Income Ratio | 0.00% | 0.00% | 0.00% | 0.00% | 0.00% | 0.00% |
| EPS | 0.00 | -0.02 | -0.06 | 0.02 | -0.01 | 0.00 |
| EPS Diluted | 0.00 | -0.02 | -0.06 | 0.02 | -0.01 | 0.00 |
| Weighted Avg Shares Out | 62.20M | 52.54M | 49.57M | 49.57M | 49.57M | 49.57M |
| Weighted Avg Shares Out (Dil) | 63.70M | 52.54M | 49.57M | 49.57M | 49.57M | 49.57M |

Headwater Gold to Present at the Battery & Precious Metals Virtual Investor Conference July 24ᵗʰ

Headwater Gold strategy positions young explorer to make progress in any market

Precious Metals Royalty And Streaming Companies: The February Report
Source: https://incomestatements.info
Category: Stock Reports
