See more : Isolite Insulating Products Co., Ltd. (5358.T) Income Statement Analysis – Financial Results
Complete financial analysis of Kirkland Lake Gold Ltd. (KL) income statement, including revenue, profit margins, EPS and key performance metrics. Get detailed insights into the financial performance of Kirkland Lake Gold Ltd., a leading company in the Gold industry within the Basic Materials sector.
- Toabo Corporation (3204.T) Income Statement Analysis – Financial Results
- Sintex Industries Limited (SINTEX.NS) Income Statement Analysis – Financial Results
- Dune Acquisition Corporation (DUNEW) Income Statement Analysis – Financial Results
- Shanxi Huhua Group Co., Ltd. (003002.SZ) Income Statement Analysis – Financial Results
- Fukushima Galilei Co.Ltd. (6420.T) Income Statement Analysis – Financial Results
Kirkland Lake Gold Ltd. (KL)
About Kirkland Lake Gold Ltd.
Kirkland Lake Gold Ltd. engages in the acquisition, production, and operation of gold properties. The company holds interest in the Fosterville Mine located in the State of Victoria, Australia; and the Macassa Mine situated in the Municipality of Kirkland Lake, Ontario, Canada, as well as the Detour Lake Mine located in northeastern Ontario, Canada. It has a strategic alliance agreement with Newmont Corporation. The company was formerly known as Newmarket Gold Inc. and changed its name to Kirkland Lake Gold Ltd. in December 2016. Kirkland Lake Gold Ltd. is headquartered in Toronto, Canada. As of February 8, 2022, Kirkland Lake Gold Ltd. operates as a subsidiary of Agnico Eagle Mines Limited.
| Metric | 2020 | 2019 | 2018 | 2017 | 2016 | 2015 | 2014 | 2013 | 2012 | 2011 | 2010 | 2009 | 2008 | 2007 | 2006 | 2005 | 2004 | 2003 | 2002 |
|---|---|---|---|---|---|---|---|---|---|---|---|---|---|---|---|---|---|---|---|
| Revenue | 2.46B | 1.38B | 915.91M | 747.50M | 406.66M | 182.87M | 158.14M | 149.90M | 162.88M | 111.29M | 51.02M | 36.47M | 41.07M | 33.09M | 31.43M | 17.56M | 7.15M | 8.17M | 0.00 |
| Cost of Revenue | 1.06B | 486.39M | 427.57M | 458.37M | 273.02M | 141.21M | 148.55M | 122.54M | 100.21M | 70.42M | 49.65M | 35.18M | 0.00 | 0.00 | 28.79M | 28.71M | 18.25M | 7.53M | 0.00 |
| Gross Profit | 1.40B | 893.60M | 488.34M | 289.13M | 133.64M | 41.67M | 9.59M | 27.36M | 62.67M | 40.86M | 1.38M | 1.30M | 41.07M | 33.09M | 2.64M | -11.15M | -11.11M | 639.84K | 0.00 |
| Gross Profit Ratio | 57.08% | 64.75% | 53.32% | 38.68% | 32.86% | 22.78% | 6.06% | 18.25% | 38.48% | 36.72% | 2.70% | 3.55% | 100.00% | 100.00% | 8.39% | -63.47% | -155.38% | 7.83% | 0.00% |
| Research & Development | 0.00 | 33.47M | 66.61M | 48.41M | 0.00 | 0.00 | 0.00 | 0.00 | 0.00 | 0.00 | 0.00 | 0.00 | 3.84M | 4.39M | 0.00 | 0.00 | 0.00 | 0.00 | 0.00 |
| General & Administrative | 60.49M | 45.37M | 31.57M | 24.19M | 10.37M | 5.69M | 5.05M | 5.52M | 5.41M | 3.35M | 3.65M | 0.00 | 1.64M | 1.30M | 1.72M | 0.00 | 0.00 | 0.00 | 0.00 |
| Selling & Marketing | 0.00 | 0.00 | 0.00 | 0.00 | 0.00 | 0.00 | 0.00 | 0.00 | 0.00 | 0.00 | 0.00 | 0.00 | 0.00 | 0.00 | 0.00 | 0.00 | 0.00 | 0.00 | 0.00 |
| SG&A | 60.49M | 45.37M | 31.57M | 24.19M | 10.37M | 5.69M | 5.05M | 5.52M | 5.41M | 3.35M | 3.65M | 0.00 | 1.64M | 1.30M | 1.72M | 0.00 | 0.00 | 0.00 | 0.00 |
| Other Expenses | 81.15M | 2.04M | 4.23M | 12.88M | 19.90M | 5.08M | 6.88M | 16.90M | 14.51M | 17.83M | 9.35M | 10.54M | 0.00 | 0.00 | 7.94M | 11.25M | 4.93M | 3.55M | 1.30M |
| Operating Expenses | 141.64M | 80.87M | 102.41M | 85.48M | 30.26M | 10.77M | 11.93M | 22.41M | 19.93M | 21.18M | 13.00M | 10.54M | 5.49M | 5.69M | 9.66M | 11.25M | 4.93M | 3.55M | 1.30M |
| Cost & Expenses | 1.20B | 567.65M | 528.83M | 544.70M | 303.28M | 151.98M | 160.48M | 144.95M | 120.13M | 91.60M | 62.64M | 45.71M | 44.41M | 41.25M | 38.45M | 39.97M | 23.18M | 11.08M | 1.30M |
| Interest Income | 3.54M | 6.94M | 5.71M | 2.11M | 843.00K | 3.08M | 1.07M | 1.17M | 644.07K | 773.46K | 443.67K | 494.37K | 1.58M | 869.95K | 576.50K | 0.00 | 0.00 | 0.00 | 0.00 |
| Interest Expense | 3.53M | 922.00K | 1.50M | 9.59M | 10.95M | 12.76M | 13.00M | 8.86M | 252.74K | 33.48K | 46.09K | 33.69K | 73.15K | 85.80K | 57.93K | 0.00 | 0.00 | 0.00 | 0.00 |
| Depreciation & Amortization | -73.26M | 168.92M | 133.72M | 148.66M | 202.00K | 28.51M | 1.07M | 1.17M | 644.07K | 644.27K | -500.40K | 33.69K | 73.15K | 85.80K | 3.45M | 1.87M | 896.06K | 547.97K | 143.85K |
| EBITDA | 1.16B | 968.03M | 529.52M | 329.42M | 84.21M | 62.49M | -1.27M | 6.12M | 43.39M | 20.33M | -12.17M | -8.75M | -3.24M | -8.07M | -3.01M | -21.25M | -15.59M | -2.90M | -1.25M |
| EBITDA Ratio | 47.00% | 70.15% | 57.81% | 44.07% | 20.71% | 34.17% | -0.80% | 4.08% | 26.64% | 18.26% | -23.84% | -23.98% | -7.89% | -24.38% | -9.58% | -121.00% | -218.07% | -35.45% | 0.00% |
| Operating Income | 1.23B | 799.10M | 395.81M | 180.77M | 84.01M | 33.98M | -2.34M | 4.95M | 42.75M | 19.68M | -11.67M | -8.78M | -3.32M | -8.15M | -6.46M | -23.12M | -16.48M | -3.44M | -1.39M |
| Operating Income Ratio | 49.98% | 57.91% | 43.21% | 24.18% | 20.66% | 18.58% | -1.48% | 3.30% | 26.24% | 17.69% | -22.86% | -24.08% | -8.07% | -24.64% | -20.55% | -131.63% | -230.61% | -42.16% | 0.00% |
| Total Other Income/Expenses | -76.78M | -922.00K | -1.50M | 15.31M | -10.75M | -12.76M | -11.92M | -7.69M | 391.33K | 610.79K | -990.17K | 0.00 | 0.00 | 0.00 | -57.93K | 0.00 | -204.61K | -164.92K | 9.03K |
| Income Before Tax | 1.15B | 798.18M | 394.31M | 196.08M | 73.26M | 21.21M | -14.26M | -2.74M | 43.14M | 20.29M | -12.66M | 0.00 | -3.32M | -8.15M | -6.52M | -23.12M | -16.69M | -3.61M | -1.38M |
| Income Before Tax Ratio | 46.86% | 57.84% | 43.05% | 26.23% | 18.02% | 11.60% | -9.02% | -1.83% | 26.48% | 18.23% | -24.80% | 0.00% | -8.07% | -24.64% | -20.73% | -131.63% | -233.47% | -44.18% | 0.00% |
| Income Tax Expense | 365.00M | 238.10M | 120.37M | 38.75M | 31.16M | 4.76M | -4.15M | 862.70K | 1.08M | -965.61K | 500.40K | -33.69K | -73.15K | -586.62K | -738.18K | -796.83K | -204.61K | -164.92K | 9.03K |
| Net Income | 787.71M | 560.08M | 273.94M | 157.33M | 42.11M | 16.46M | -10.11M | -3.60M | 42.06M | 21.26M | -13.16M | -8.75M | -3.24M | -7.57M | -5.78M | -22.32M | -16.48M | -3.44M | -1.39M |
| Net Income Ratio | 32.02% | 40.59% | 29.91% | 21.05% | 10.35% | 9.00% | -6.39% | -2.40% | 25.82% | 19.10% | -25.78% | -23.98% | -7.89% | -22.87% | -18.38% | -127.09% | -230.61% | -42.16% | 0.00% |
| EPS | 2.90 | 2.65 | 1.29 | 0.76 | 0.35 | 0.22 | -0.14 | -0.05 | 0.59 | 0.31 | -0.21 | -0.16 | -0.06 | -0.14 | -0.12 | -0.54 | -0.56 | -0.17 | -0.10 |
| EPS Diluted | 2.90 | 2.65 | 1.29 | 0.75 | 0.34 | 0.22 | -0.14 | -0.05 | 0.58 | 0.31 | -0.21 | -0.16 | -0.06 | -0.14 | -0.12 | -0.54 | -0.56 | -0.17 | -0.10 |
| Weighted Avg Shares Out | 271.36M | 211.65M | 212.62M | 207.44M | 121.17M | 73.33M | 70.15M | 70.15M | 71.53M | 68.28M | 62.63M | 56.35M | 55.47M | 52.95M | 48.12M | 41.61M | 29.69M | 19.94M | 13.39M |
| Weighted Avg Shares Out (Dil) | 271.36M | 211.65M | 212.62M | 208.63M | 123.89M | 74.15M | 70.15M | 70.15M | 72.07M | 68.67M | 62.63M | 56.35M | 55.47M | 52.95M | 48.12M | 41.61M | 29.69M | 19.94M | 13.39M |

Kirkland Lake Discoveries Reports Annual & Special Meeting Results

Kirkland Lake Discoveries Announces Phase 1 Drilling Completion and Provides Exploration Update

Building a top three silver mine - Tony Makuch leads Discovery Silver after Kirkland Lake success

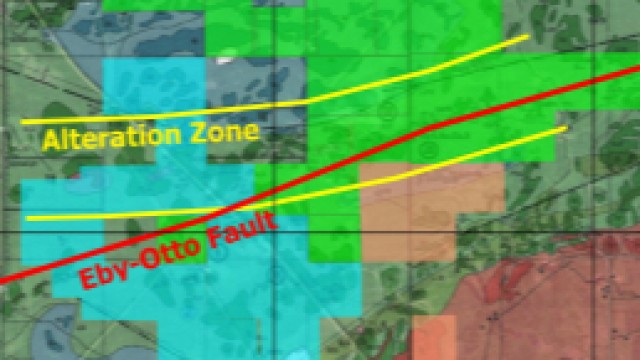
Canada Silver Cobalt begins exploration at its Eby-Otto gold property near Kirkland Lake in Ontario

Canada Silver Cobalt Works announces deal to buy Allsopp property expanding its Eby-Otto gold property in prolific Kirkland Lake area

Agnico Eagle and Kirkland Lake Gold complete merger, creating the top 3 gold producer

3 Profitable Businesses With Solid Financial Conditions

Kirkland Lake Gold (KL) Delivers Record Production in Q4 & FY21

Kirkland Lake Gold: Another Blowout Quarter Preceding Agnico Merger

Kirkland Lake Gold achieves record production in 2021, beats guidance
Source: https://incomestatements.info
Category: Stock Reports
