See more : Intrasense SA (ALINS.PA) Income Statement Analysis – Financial Results
Complete financial analysis of South32 Limited (SOUHY) income statement, including revenue, profit margins, EPS and key performance metrics. Get detailed insights into the financial performance of South32 Limited, a leading company in the Industrial Materials industry within the Basic Materials sector.
- Axtel, S.A.B. de C.V. (AXTELCPO.MX) Income Statement Analysis – Financial Results
- Mehai Technology Limited (MEHAI.BO) Income Statement Analysis – Financial Results
- TV Asahi Holdings Corporation (9409.T) Income Statement Analysis – Financial Results
- Jay Shree Tea & Industries Limited (JAYSHREETEA.BO) Income Statement Analysis – Financial Results
- BTU Metals Corp. (BTUMF) Income Statement Analysis – Financial Results
South32 Limited (SOUHY)
About South32 Limited
South32 Limited operates as a diversified metals and mining company in Australia, Southern Africa, North America, and South America. The company operates through Worsley Alumina, Hillside Aluminium, Mozal Aluminium, Brazil Alumina, Illawarra Metallurgical Coal, Eagle Downs Metallurgical Coal, Australia Manganese, South Africa Managanese, Cerro Matoso, Cannington, Hermosa, and South Africa Energy Coal segments. It has a portfolio of assets producing alumina, aluminum, bauxite, energy and metallurgical coal, manganese ore and alloy, ferronickel, silver, lead, zinc, and other base metals. The company also exports its products. South32 Limited has a strategic alliance agreement with AusQuest Limited for exploration opportunity in gold-copper targets at the Gunanya Project. The company was formerly known as BHP Coal Holdings Pty Limited and changed its name to South32 Limited. South32 Limited was incorporated in 2000 and is headquartered in Perth, Australia.
| Metric | 2024 | 2023 | 2022 | 2021 | 2020 | 2019 | 2018 | 2017 | 2016 | 2015 | 2014 | 2013 | 2012 |
|---|---|---|---|---|---|---|---|---|---|---|---|---|---|
| Revenue | 5.48B | 7.54B | 9.38B | 5.58B | 5.13B | 7.52B | 7.74B | 7.20B | 6.12B | 3.84B | 8.34B | 12.09B | 13.84B |
| Cost of Revenue | 3.62B | 3.59B | 3.19B | 2.21B | 2.28B | 3.21B | 3.32B | 3.03B | 2.95B | 2.34B | 3.31B | 6.15B | 6.67B |
| Gross Profit | 1.86B | 3.95B | 6.19B | 3.37B | 2.85B | 4.31B | 4.42B | 4.17B | 3.17B | 1.50B | 5.04B | 5.94B | 7.17B |
| Gross Profit Ratio | 34.02% | 52.41% | 65.98% | 60.38% | 55.54% | 57.31% | 57.12% | 57.89% | 51.81% | 39.11% | 60.35% | 49.15% | 51.82% |
| Research & Development | 0.00 | 0.00 | 0.00 | 0.00 | 0.00 | 0.00 | 0.00 | 0.00 | 0.00 | 0.00 | 16.00M | 18.00M | 19.00M |
| General & Administrative | 0.00 | 0.00 | 0.00 | 0.00 | 0.00 | 0.00 | 0.00 | 0.00 | 0.00 | 0.00 | 0.00 | 0.00 | 0.00 |
| Selling & Marketing | 0.00 | 0.00 | 0.00 | 0.00 | 0.00 | 0.00 | 0.00 | 0.00 | 0.00 | 0.00 | 0.00 | 0.00 | 0.00 |
| SG&A | 1.61B | 2.06B | 1.95B | 1.71B | 1.61B | 2.40B | 2.24B | 1.98B | 1.97B | 1.23B | 427.00M | 4.15B | 0.00 |
| Other Expenses | 989.00M | -7.48B | 183.00M | 157.00M | 123.00M | -6.85B | -6.35B | -5.47B | -6.92B | -4.10B | -8.07B | 102.00M | 41.00M |
| Operating Expenses | 2.60B | 3.84B | 2.49B | 3.27B | 2.47B | 3.50B | 2.80B | 2.53B | 4.71B | 4.10B | 8.07B | 4.93B | 5.28B |
| Cost & Expenses | 6.32B | 7.43B | 5.68B | 5.48B | 4.76B | 6.71B | 6.12B | 5.56B | 7.66B | 4.10B | 8.07B | 11.08B | 11.95B |
| Interest Income | 222.00M | 102.00M | 5.00M | 53.00M | 34.00M | 3.00M | 2.00M | 9.00M | 7.00M | 22.00M | 41.00M | 130.00M | 155.00M |
| Interest Expense | 244.00M | 215.00M | 152.00M | 132.00M | 126.00M | 182.00M | 185.00M | 180.00M | 150.00M | 94.00M | 187.00M | 279.00M | 241.00M |
| Depreciation & Amortization | 643.00M | 653.00M | 624.00M | 720.00M | 739.00M | 757.00M | 742.00M | 763.00M | 775.00M | 477.00M | 985.00M | 964.00M | 905.00M |
| EBITDA | -19.00M | 791.00M | 4.05B | 1.47B | 932.00M | 1.70B | 1.94B | 2.25B | -620.00M | 173.00M | 117.00M | 147.00M | 3.16B |
| EBITDA Ratio | -0.35% | 20.99% | 43.24% | 26.28% | 18.16% | 22.65% | 25.04% | 31.33% | 15.93% | 4.55% | 15.84% | 19.38% | 22.80% |
| Operating Income | -735.00M | 929.00M | 3.43B | 773.00M | 240.00M | 946.00M | 1.20B | 1.49B | 200.00M | -331.00M | 337.00M | -963.00M | 2.06B |
| Operating Income Ratio | -13.41% | 12.33% | 36.59% | 13.86% | 4.68% | 12.58% | 15.46% | 20.72% | 3.27% | -8.61% | 4.04% | -7.96% | 14.89% |
| Total Other Income/Expenses | -11.00M | 22.00M | 263.00M | -161.00M | 104.00M | -1.11B | -560.00M | -566.00M | -104.00M | -67.00M | -15.00M | -2.18B | -42.00M |
| Income Before Tax | -746.00M | 213.00M | 3.69B | 42.00M | 344.00M | 803.00M | 1.62B | 1.62B | -1.55B | -398.00M | 150.00M | -1.10B | 2.02B |
| Income Before Tax Ratio | -13.62% | 2.83% | 39.39% | 0.75% | 6.70% | 10.68% | 20.91% | 22.57% | -25.25% | -10.36% | 1.80% | -9.06% | 14.59% |
| Income Tax Expense | -106.00M | 386.00M | 1.02B | 100.00M | 186.00M | 414.00M | 287.00M | 393.00M | 70.00M | 528.00M | 47.00M | 208.00M | 585.00M |
| Net Income | -203.00M | -173.00M | 2.67B | 142.00M | 158.00M | 389.00M | 1.33B | 1.23B | -1.62B | -919.00M | 103.00M | -1.47B | 1.40B |
| Net Income Ratio | -3.71% | -2.30% | 28.47% | 2.55% | 3.08% | 5.17% | 17.20% | 17.11% | -26.39% | -23.91% | 1.23% | -12.13% | 10.13% |
| EPS | -0.22 | -0.04 | 0.57 | 0.03 | 0.03 | 0.08 | 0.26 | 0.23 | -0.30 | -0.27 | 0.03 | -0.28 | 0.26 |
| EPS Diluted | -0.22 | -0.04 | 0.57 | 0.03 | 0.03 | 0.08 | 0.25 | 0.23 | -0.30 | -0.27 | 0.03 | -0.28 | 0.26 |
| Weighted Avg Shares Out | 903.80M | 4.55B | 4.65B | 4.77B | 4.89B | 5.05B | 5.16B | 5.31B | 5.32B | 3.44B | 3.21B | 5.32B | 5.32B |
| Weighted Avg Shares Out (Dil) | 903.80M | 4.57B | 4.68B | 4.79B | 4.90B | 5.11B | 5.24B | 5.37B | 5.32B | 3.44B | 3.21B | 5.32B | 5.35B |

American Eagle Announces Closing of C$29 Million Strategic Investment by South32
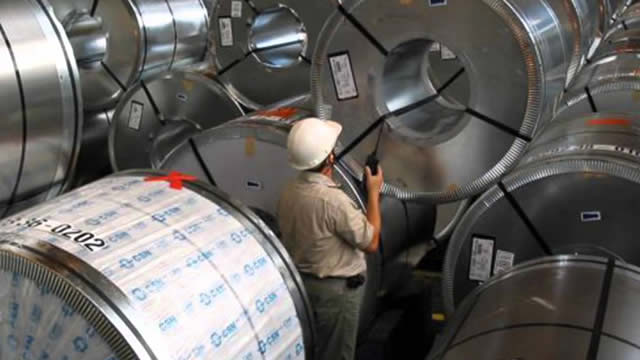
South32 Is A Buy With New Repurchase Plan And Results Beat (Rating Upgrade)

FLSmidth to deliver concentrate and tailings filters to South32's Hermosa critical minerals project in the United States
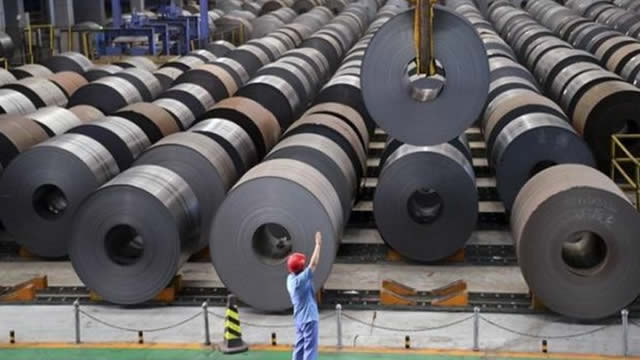
South32 (SOUHY) Upgraded to Buy: Here's Why
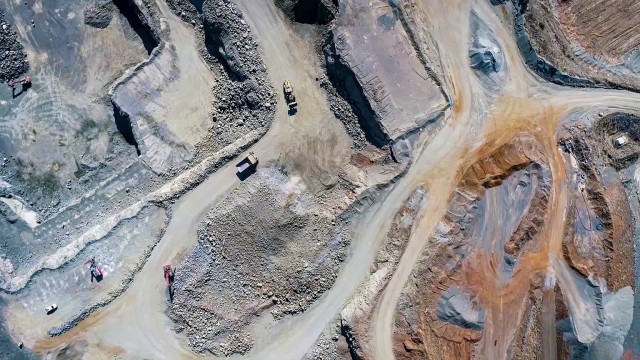
South32: Watch Capital Return And Capital Recycling Catalysts
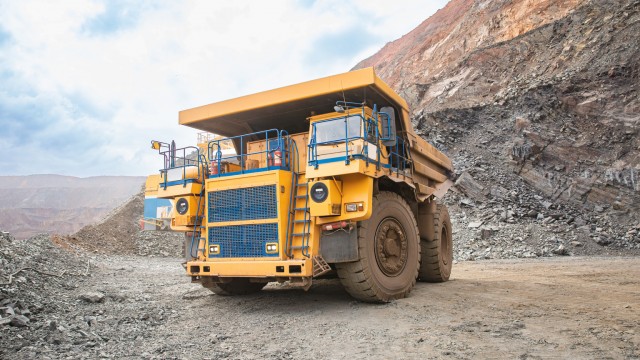
South32: Decarbonization Play With Good Financial Strength
New Strong Sell Stocks for June 7th

South32's copper equivalent production up 7% in 9M of fiscal 2023

South32 Ltd. (SOUHY) Upgraded to Strong Buy: Here's What You Should Know

Is South32 (SOUHY) Outperforming Other Basic Materials Stocks This Year?
Source: https://incomestatements.info
Category: Stock Reports
