See more : Open House Group Co., Ltd. (3288.T) Income Statement Analysis – Financial Results
Complete financial analysis of Santacruz Silver Mining Ltd. (SZSMF) income statement, including revenue, profit margins, EPS and key performance metrics. Get detailed insights into the financial performance of Santacruz Silver Mining Ltd., a leading company in the Silver industry within the Basic Materials sector.
- LVMC Holdings (900140.KS) Income Statement Analysis – Financial Results
- The Berkeley Group Holdings plc (BKGFF) Income Statement Analysis – Financial Results
- Canoo Holdings Ltd. (GOEVW) Income Statement Analysis – Financial Results
- Pacific Smiles Group Limited (PSQ.AX) Income Statement Analysis – Financial Results
- Public Storage (PSA-PF) Income Statement Analysis – Financial Results
Santacruz Silver Mining Ltd. (SZSMF)
About Santacruz Silver Mining Ltd.
Santacruz Silver Mining Ltd., together with its subsidiaries, engages in the acquisition, exploration, development, and operation of mineral properties in Mexico. The company primarily explores for silver and zinc, as well as lead and copper deposits. It holds interests in the Zimapan Mine that consists of 34 mining concessions covering an area of 5,139 hectares located in Hidalgo, Mexico; and two exploration properties, which include the La Pechuga Property and the Santa Gorgonia Prospect. The company was formerly known as Forte Resources Inc. and changed its name to Santacruz Silver Mining Ltd. in April 2012. Santacruz Silver Mining Ltd. was incorporated in 2011 and is based in Vancouver, Canada.
| Metric | 2023 | 2022 | 2021 | 2020 | 2019 | 2018 | 2017 | 2016 | 2015 | 2014 | 2013 | 2012 | 2011 | 2010 |
|---|---|---|---|---|---|---|---|---|---|---|---|---|---|---|
| Revenue | 255.86M | 278.59M | 53.33M | 33.10M | 29.11M | 13.15M | 11.40M | 11.81M | 8.64M | 10.63M | 0.00 | 0.00 | 0.00 | 0.00 |
| Cost of Revenue | 214.23M | 255.72M | 43.04M | 32.11M | 30.82M | 17.21M | 16.55M | 11.86M | 10.68M | 12.65M | 0.00 | 0.00 | 0.00 | 0.00 |
| Gross Profit | 41.64M | 22.87M | 10.30M | 988.00K | -1.71M | -4.06M | -5.16M | -51.00K | -2.04M | -2.02M | 0.00 | 0.00 | 0.00 | 0.00 |
| Gross Profit Ratio | 16.27% | 8.21% | 19.31% | 2.99% | -5.88% | -30.87% | -45.24% | -0.43% | -23.59% | -19.01% | 0.00% | 0.00% | 0.00% | 0.00% |
| Research & Development | 0.00 | 0.00 | 0.00 | 0.00 | 0.00 | 0.00 | 0.00 | 0.00 | 0.00 | 0.00 | 0.00 | 0.00 | 0.00 | 0.00 |
| General & Administrative | 21.17M | 22.81M | 11.91M | 4.38M | 4.06M | 1.48M | 1.87M | 1.90M | 1.76M | 2.84M | 2.76M | 5.46M | 451.98K | 959.00 |
| Selling & Marketing | 229.00K | 0.00 | 1.77M | 1.89M | 1.35M | 0.00 | 0.00 | 0.00 | 0.00 | 0.00 | 0.00 | 191.35K | 17.56K | 0.00 |
| SG&A | 26.91M | 22.81M | 13.68M | 6.26M | 4.06M | 1.48M | 1.87M | 1.90M | 1.76M | 2.84M | 2.76M | 5.65M | 451.98K | 959.00 |
| Other Expenses | 2.46M | 0.00 | 0.00 | 0.00 | 0.00 | 0.00 | 0.00 | 164.01K | 0.00 | 0.00 | 0.00 | 0.00 | 9.61K | 0.00 |
| Operating Expenses | 24.45M | 24.05M | 15.76M | 7.20M | 4.68M | 1.60M | 1.92M | 2.22M | 1.77M | 2.85M | 2.77M | 5.65M | 587.19K | 3.71K |
| Cost & Expenses | 238.68M | 279.77M | 58.79M | 39.30M | 35.50M | 18.81M | 18.47M | 14.08M | 12.45M | 15.50M | 2.77M | 5.65M | 587.19K | 3.71K |
| Interest Income | 3.00M | 947.00K | 274.00K | 215.00K | 571.00K | 0.00 | 21.00K | 6.00K | 12.00K | 12.61K | 323.61K | 0.00 | 0.00 | 0.00 |
| Interest Expense | 2.50M | 4.26M | 3.29M | 802.00K | 983.00K | 891.00K | 285.00K | 2.36M | 5.05M | 957.73K | 0.00 | 0.00 | 2.79K | 0.00 |
| Depreciation & Amortization | 23.28M | 15.26M | 4.57M | 801.20K | 1.24M | 1.93M | 2.27M | 2.35M | 1.74M | 1.49M | 9.34K | 5.98K | 6.14K | 0.00 |
| EBITDA | 40.47M | 11.95M | -2.61M | -5.06M | -18.27M | -3.66M | -22.05M | -13.97M | -18.77M | -3.08M | -3.22M | 7.09M | -581.06K | -3.71K |
| EBITDA Ratio | 15.82% | 4.29% | -2.31% | -15.28% | -18.03% | -27.85% | -38.89% | 13.94% | 9.65% | -50.48% | 0.00% | 0.00% | 0.00% | 0.00% |
| Operating Income | 17.19M | 66.00K | -6.77M | -5.74M | -18.52M | -4.22M | -27.53M | -17.89M | -23.41M | -4.89M | -2.80M | -5.66M | -587.20K | -3.71K |
| Operating Income Ratio | 6.72% | 0.02% | -12.69% | -17.36% | -63.63% | -32.12% | -241.59% | -151.41% | -270.87% | -46.01% | 0.00% | 0.00% | 0.00% | 0.00% |
| Total Other Income/Expenses | 9.68M | -12.26M | -1.47M | 4.62M | -5.39M | 1.14M | 2.60M | -944.00K | -2.22M | -2.95M | -37.34K | -12.73M | -84.12K | 0.00 |
| Income Before Tax | 26.87M | -16.02M | -8.24M | -1.40M | -20.39M | -4.23M | -24.49M | -18.79M | -25.55M | -7.83M | -2.31M | -18.39M | -577.58K | 0.00 |
| Income Before Tax Ratio | 10.50% | -5.75% | -15.45% | -4.23% | -70.05% | -32.16% | -214.91% | -159.05% | -295.65% | -73.73% | 0.00% | 0.00% | 0.00% | 0.00% |
| Income Tax Expense | 10.42M | 6.24M | 3.32M | 92.00K | 41.00K | 408.00K | -1.59M | -281.00K | -1.32M | 870.97K | 4.00M | 34.01K | 2.78K | 3.71K |
| Net Income | 16.15M | -22.26M | -11.57M | -1.49M | -20.57M | -4.64M | -22.91M | -18.51M | -24.23M | -8.71M | -6.32M | -18.42M | -580.36K | -3.71K |
| Net Income Ratio | 6.31% | -7.99% | -21.68% | -4.51% | -70.66% | -35.26% | -201.00% | -156.67% | -280.37% | -81.92% | 0.00% | 0.00% | 0.00% | 0.00% |
| EPS | 0.05 | -0.07 | -0.04 | -0.01 | -0.11 | -0.03 | -0.14 | -0.14 | -0.23 | -0.09 | -0.07 | -0.33 | -0.17 | -0.04 |
| EPS Diluted | 0.05 | -0.07 | -0.04 | -0.01 | -0.11 | -0.03 | -0.14 | -0.14 | -0.23 | -0.09 | -0.07 | -0.33 | -0.17 | -0.04 |
| Weighted Avg Shares Out | 349.94M | 339.10M | 308.02M | 221.16M | 181.65M | 174.45M | 168.32M | 132.28M | 105.29M | 101.19M | 87.43M | 55.09M | 3.50M | 91.58K |
| Weighted Avg Shares Out (Dil) | 352.30M | 339.10M | 308.02M | 221.16M | 181.65M | 174.45M | 168.32M | 132.28M | 105.29M | 101.19M | 87.43M | 55.09M | 3.50M | 91.58K |

Santacruz Silver Q3 profits boosted by operational efficiencies, higher silver prices
Santacruz Silver Mining releases 2023 Sustainability Report highlighting ESG progress in Bolivia
Santacruz Silver reports improved production in Q3, citing operational optimization
Santacruz Silver announces appointment of interim finance chief
Santacruz Silver: It's Time To Leverage Up On Silver
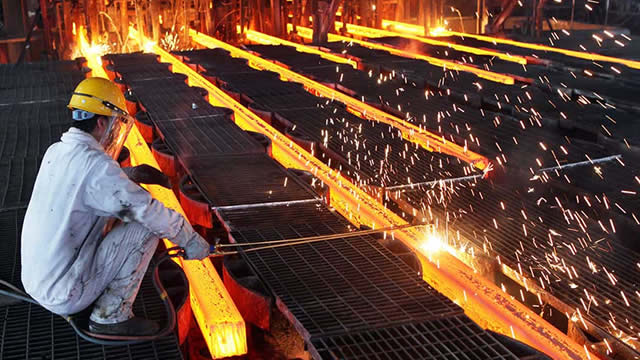
Santacruz Silver Mining announces amendments to sale terms for Glencore's Bolivian mining assets
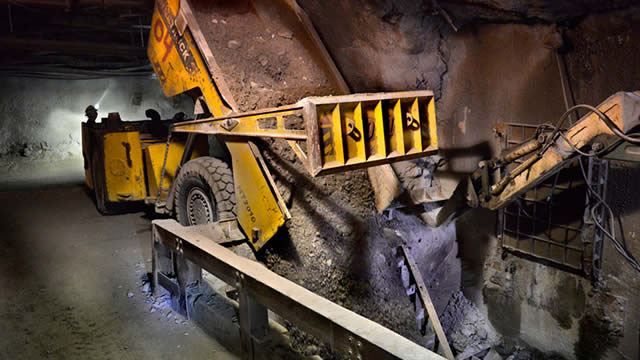
Santacruz Silver Mining CEO discusses Q2 successes – ICYMI
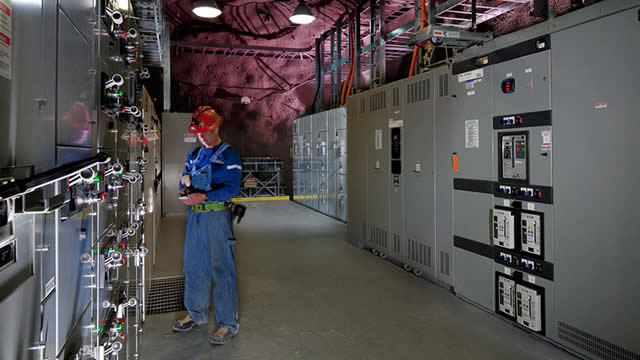
Santacruz Silver highlights growth potential in Bolivian mining assets with new estimates
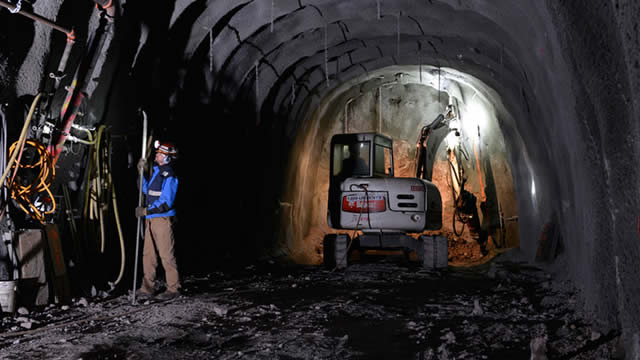
Santacruz Silver Q2 revenue boosted by higher precious metals prices
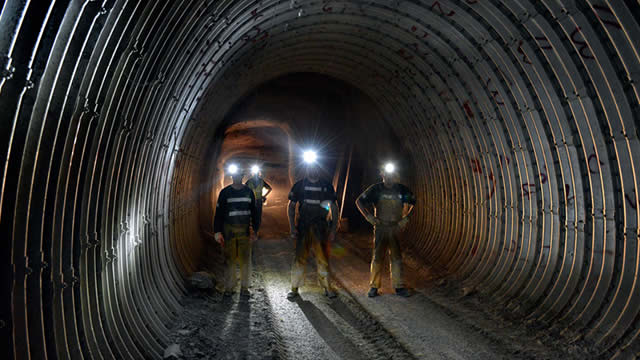
Santacruz Silver Mining sees significant Q2 production boost
Source: https://incomestatements.info
Category: Stock Reports
