See more : Paradise Co., Ltd. (034230.KQ) Income Statement Analysis – Financial Results
Complete financial analysis of Yellow Cake plc (YLLXF) income statement, including revenue, profit margins, EPS and key performance metrics. Get detailed insights into the financial performance of Yellow Cake plc, a leading company in the Uranium industry within the Energy sector.
- The Byke Hospitality Limited (BYKE.NS) Income Statement Analysis – Financial Results
- Jack Chia Industries (Thailand) Public Company Limited (JCT.BK) Income Statement Analysis – Financial Results
- Bowl America Incorporated (BWL-A) Income Statement Analysis – Financial Results
- Microchip Technology Incorporated (MCHP) Income Statement Analysis – Financial Results
- WhiteHorse Finance, Inc. 7.875% Notes due 2028 (WHFCL) Income Statement Analysis – Financial Results
Yellow Cake plc (YLLXF)
About Yellow Cake plc
Yellow Cake plc, a specialist company, operates in the uranium sector. It is involved in the purchase and holding of uranium oxide concentrates; and exploitation of other uranium-related opportunities. The company was incorporated in 2018 and is headquartered in Saint Helier, Jersey.
| Metric | 2024 | 2023 | 2022 | 2021 | 2020 | 2019 |
|---|---|---|---|---|---|---|
| Revenue | 735.02M | -96.90M | -5.96M | 1.33M | 15.93M | 31.21M |
| Cost of Revenue | 0.00 | 226.00K | 1.88M | 282.00K | 152.00K | 0.00 |
| Gross Profit | 735.02M | -97.13M | -7.84M | 1.04M | 15.77M | 31.21M |
| Gross Profit Ratio | 100.00% | 100.23% | 131.62% | 78.72% | 99.05% | 100.00% |
| Research & Development | 0.00 | 0.00 | 0.00 | 0.00 | 0.00 | 0.00 |
| General & Administrative | 3.92M | 4.00M | 3.00M | 1.89M | 1.75M | 1.96M |
| Selling & Marketing | 8.18M | 226.00K | 1.88M | 282.00K | 152.00K | 1.53M |
| SG&A | 12.09M | 4.00M | 3.00M | 1.89M | 1.75M | 3.48M |
| Other Expenses | 0.00 | 0.00 | 0.00 | 0.00 | 0.00 | 0.00 |
| Operating Expenses | 12.09M | 6.60M | 4.53M | 3.00M | 2.78M | 3.48M |
| Cost & Expenses | 12.09M | 6.83M | 6.41M | 3.28M | 2.93M | 3.48M |
| Interest Income | 4.79M | 576.00K | 11.00K | 3.00K | 104.00K | 26.81K |
| Interest Expense | 0.00 | 0.00 | 0.00 | 0.00 | 0.00 | 0.00 |
| Depreciation & Amortization | -206.00K | 103.73M | -534.00K | -30.63M | -16.47M | -28.20M |
| EBITDA | 722.72M | -1.77M | -12.37M | -33.87M | -18.31M | -3.48M |
| EBITDA Ratio | 98.33% | -93.10% | 7,417.24% | -2,556.15% | -114.94% | -11.16% |
| Operating Income | 722.93M | 90.22M | -441.92M | -33.87M | -18.31M | -3.48M |
| Operating Income Ratio | 98.35% | -93.10% | 7,417.24% | -2,556.15% | -114.94% | -11.16% |
| Total Other Income/Expenses | 4.08M | -95.94M | 429.64M | 31.87M | 2.05M | 408.06K |
| Income Before Tax | 727.01M | -102.94M | 417.27M | 29.91M | 12.51M | 29.48M |
| Income Before Tax Ratio | 98.91% | 106.23% | -7,003.54% | 2,257.43% | 78.54% | 94.47% |
| Income Tax Expense | 0.00 | -103.73M | 534.00K | 30.63M | 16.47M | -171.86K |
| Net Income | 727.01M | -102.94M | 417.27M | 29.91M | 12.51M | 29.48M |
| Net Income Ratio | 98.91% | 106.23% | -7,003.54% | 2,257.43% | 78.54% | 94.47% |
| EPS | 3.50 | -0.56 | 2.50 | 0.35 | 0.14 | 0.39 |
| EPS Diluted | 3.50 | -0.56 | 2.49 | 0.35 | 0.14 | 0.39 |
| Weighted Avg Shares Out | 207.72M | 185.32M | 160.75M | 89.02M | 87.82M | 76.18M |
| Weighted Avg Shares Out (Dil) | 207.67M | 185.32M | 161.05M | 89.02M | 87.82M | 76.18M |
Yellow Cake: A Bright Future Ahead

URNJ: The Demand For Uranium Continues To Grow

Yellow Cake: Offered At An Implied Uranium Price Of $64/Lb
Yellow Cake: Now Trading With An Implied Uranium Price Of $75/Lb
Yellow Cake: Discount To Net Asset Value Now 16.4%

Yellow Cake PLC Announces Quarterly Operating Update

Uranium: Still A Lot Of Room To Run
Yellow Cake: A Way To Play The Uranium Bull Market, With A Discount To Net Asset Value
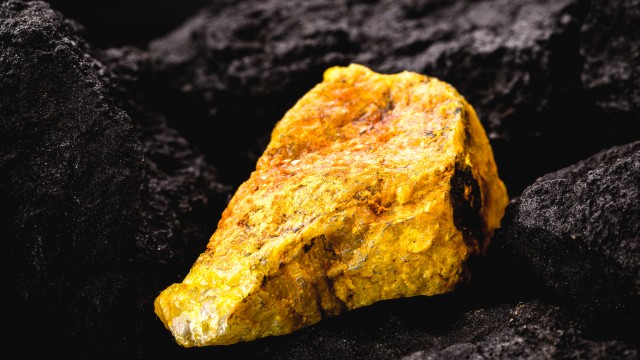
Yellow Cake: Still Offered At A Discount To NAV
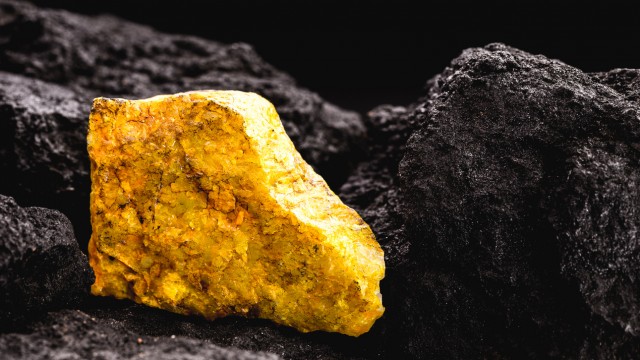
Buy Discounted Uranium With The Sprott Physical Uranium Trust & Yellow Cake
Source: https://incomestatements.info
Category: Stock Reports
