See more : Port of Tauranga Limited (PTAUF) Income Statement Analysis – Financial Results
Complete financial analysis of Okinawa Financial Group,Inc. (7350.T) income statement, including revenue, profit margins, EPS and key performance metrics. Get detailed insights into the financial performance of Okinawa Financial Group,Inc., a leading company in the Banks – Regional industry within the Financial Services sector.
- Tethys Oil AB (publ) (TETY.ST) Income Statement Analysis – Financial Results
- Kolmar Korea Co., Ltd. (161890.KS) Income Statement Analysis – Financial Results
- CECEP Environmental Protection Equipment Co.,Ltd. (300140.SZ) Income Statement Analysis – Financial Results
- Everybody Loves Languages Corp. (ELL.V) Income Statement Analysis – Financial Results
- Vontobel Holding AG (0QKE.L) Income Statement Analysis – Financial Results
Okinawa Financial Group,Inc. (7350.T)
About Okinawa Financial Group,Inc.
Okinawa Financial Group,Inc. provides various financial services. The company offers banking, general leasing, credit card, securities, guarantee, agency, and debt management and collection services. It also provides financial and economic survey and research, business management consultation services, etc.; sales channel development support services; and computer related services. The company was founded in 1956 and is headquartered in Naha, Japan.
| Metric | 2023 | 2022 | 2021 | 2020 | 2019 | 2018 | 2017 | 2016 | 2015 | 2014 | 2013 | 2012 |
|---|---|---|---|---|---|---|---|---|---|---|---|---|
| Revenue | 52.83B | 48.89B | 46.42B | 50.10B | 50.25B | 51.28B | 51.14B | 50.17B | 49.49B | 44.76B | 44.40B | 43.59B |
| Cost of Revenue | 1.97B | 0.00 | 0.00 | 0.00 | 0.00 | 0.00 | 0.00 | 0.00 | 0.00 | 0.00 | 0.00 | 0.00 |
| Gross Profit | 50.86B | 48.89B | 46.42B | 50.10B | 50.25B | 51.28B | 51.14B | 50.17B | 49.49B | 44.76B | 44.40B | 43.59B |
| Gross Profit Ratio | 96.27% | 100.00% | 100.00% | 100.00% | 100.00% | 100.00% | 100.00% | 100.00% | 100.00% | 100.00% | 100.00% | 100.00% |
| Research & Development | 0.00 | 0.00 | 0.00 | 0.00 | 0.00 | 0.00 | 0.00 | 0.00 | 0.00 | 0.00 | 0.00 | 0.00 |
| General & Administrative | 24.69B | 23.51B | 24.48B | 24.18B | 24.02B | 23.66B | 23.91B | 22.98B | 21.73B | 20.72B | 20.82B | 20.18B |
| Selling & Marketing | 0.00 | 0.00 | 0.00 | 0.00 | 0.00 | 0.00 | 0.00 | 0.00 | 0.00 | 0.00 | 0.00 | 0.00 |
| SG&A | 24.69B | 23.51B | 24.48B | 24.18B | 24.02B | 23.66B | 23.91B | 22.98B | 21.73B | 20.72B | 20.82B | 20.18B |
| Other Expenses | 24.70B | -33.93B | -25.53B | -37.77B | -38.15B | -37.23B | -37.96B | -35.55B | -32.62B | 0.00 | 0.00 | 0.00 |
| Operating Expenses | 49.39B | 39.39B | 37.54B | 37.77B | 38.15B | 37.23B | 37.96B | 35.55B | 32.62B | 33.45B | 34.09B | 32.66B |
| Cost & Expenses | 42.59B | 39.39B | 37.54B | 42.72B | 42.67B | 41.07B | 41.68B | 41.24B | 37.70B | 33.45B | 34.09B | 32.66B |
| Interest Income | 29.68B | 29.60B | 28.17B | 0.00 | 0.00 | 0.00 | 0.00 | 0.00 | 0.00 | 0.00 | 0.00 | 0.00 |
| Interest Expense | 1.20B | 417.00M | 292.00M | 47.00M | 53.00M | 68.00M | 0.00 | 0.00 | 0.00 | 0.00 | 0.00 | 0.00 |
| Depreciation & Amortization | 2.29B | 2.03B | 2.07B | 2.11B | 2.17B | 2.18B | 2.36B | 2.74B | 1.82B | -11.35B | -10.37B | -10.92B |
| EBITDA | 11.12B | 10.56B | 9.83B | 10.04B | 10.23B | 12.68B | 12.49B | 11.64B | 14.08B | -402.00M | -520.00M | -427.00M |
| EBITDA Ratio | 21.04% | 21.59% | 21.60% | -0.17% | -0.43% | -0.10% | -0.41% | -0.60% | 3.57% | -0.90% | -1.17% | -0.98% |
| Operating Income | 8.82B | 8.53B | 7.91B | 7.93B | 8.05B | 10.38B | 10.14B | 8.90B | 10.11B | 11.35B | 10.37B | 10.92B |
| Operating Income Ratio | 16.70% | 17.44% | 17.05% | 15.82% | 16.03% | 20.24% | 19.82% | 17.73% | 20.44% | 25.36% | 23.35% | 25.06% |
| Total Other Income/Expenses | 0.00 | 0.00 | 1.00M | 1.00M | 1.00M | 118.00M | 1.00M | 1.00M | 2.15B | -43.00M | -63.00M | -1.00M |
| Income Before Tax | 8.82B | 8.53B | 7.98B | 7.93B | 8.05B | 10.50B | 10.14B | 8.90B | 12.26B | 11.31B | 10.31B | 10.92B |
| Income Before Tax Ratio | 16.70% | 17.44% | 17.18% | 15.83% | 16.03% | 20.47% | 19.82% | 17.74% | 24.77% | 25.26% | 23.21% | 25.06% |
| Income Tax Expense | 2.56B | 2.69B | 2.90B | 2.64B | 2.29B | 3.13B | 3.11B | 2.77B | 4.14B | 3.63B | 4.56B | 4.54B |
| Net Income | 6.26B | 5.84B | 5.01B | 5.21B | 5.55B | 7.20B | 6.82B | 5.82B | 7.75B | 7.32B | 5.28B | 5.95B |
| Net Income Ratio | 11.85% | 11.93% | 10.80% | 10.39% | 11.04% | 14.04% | 13.33% | 11.61% | 15.65% | 16.35% | 11.90% | 13.66% |
| EPS | 290.50 | 251.03 | 207.98 | 218.80 | 232.81 | 300.43 | 284.16 | 242.80 | 321.38 | 299.72 | 215.43 | 241.80 |
| EPS Diluted | 290.18 | 250.55 | 207.78 | 218.37 | 232.35 | 299.73 | 283.35 | 242.13 | 320.50 | 299.72 | 215.44 | 241.79 |
| Weighted Avg Shares Out | 21.56M | 23.24M | 23.84M | 23.80M | 23.83M | 23.97M | 24.00M | 23.99M | 24.11M | 24.41M | 24.53M | 24.62M |
| Weighted Avg Shares Out (Dil) | 21.58M | 23.29M | 23.86M | 23.85M | 23.88M | 24.02M | 24.07M | 24.05M | 24.17M | 24.41M | 24.53M | 24.62M |

Rémy Cointreau : Déclaration des transactions sur actions propres réalisées du 28 novembre au 2 décembre 2022
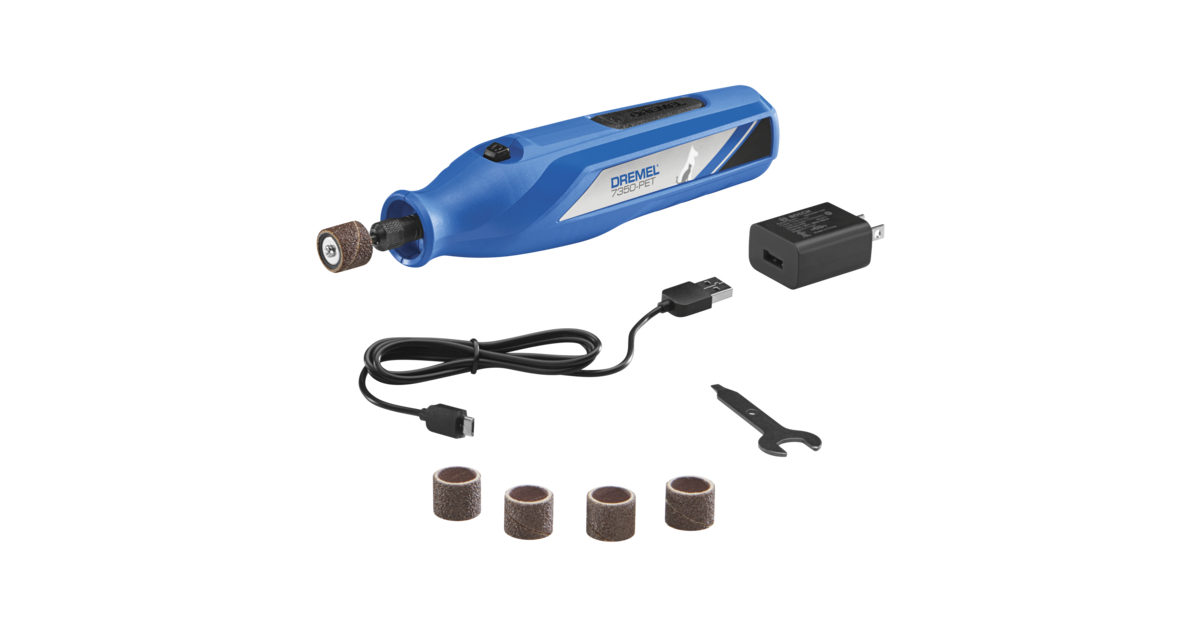
Dremel 7350-PET Cordless Pet Nail Grooming Kit is Designed with New Pet Parents in Mind

Seven Nuveen Closed-End Funds Announce Availability of 19(a) Notices

Form 8.3 - Signature Aviation PLC

Form 8.3 - Signature Aviation PLC

Form 8.3 - Signature Aviation PLC

Form 8.3 - Signature Aviation PLC

Hoffmann Green Cement Technologies : Bilan semestriel S2 2020 du contrat de liquidité confié à PORTZAMPARC - Groupe BNP PARIBAS

Form 8.3 - Signature Aviation PLC (Offeror)
Source: https://incomestatements.info
Category: Stock Reports
