See more : Semperit AG Holding (SEIGF) Income Statement Analysis – Financial Results
Complete financial analysis of Buru Energy Limited (BRNGF) income statement, including revenue, profit margins, EPS and key performance metrics. Get detailed insights into the financial performance of Buru Energy Limited, a leading company in the Oil & Gas Exploration & Production industry within the Energy sector.
- Southern Gold Limited (SAU.AX) Income Statement Analysis – Financial Results
- E-Commodities Holdings Limited (1733.HK) Income Statement Analysis – Financial Results
- Nippon Steel Corporation (NISTF) Income Statement Analysis – Financial Results
- Anhui Guofeng New Materials Co., Ltd. (000859.SZ) Income Statement Analysis – Financial Results
- Northern Data AG (NB2.F) Income Statement Analysis – Financial Results
Buru Energy Limited (BRNGF)
About Buru Energy Limited
Buru Energy Limited, together with its subsidiaries, engages in the exploration, development, and production of oil and gas resources in Western Australia. The company operates through Oil Production and Exploration segments. It holds interests in a portfolio of petroleum exploration permits covering an area of approximately 5.4 million gross acres located in Canning Basin in the southwest Kimberley region of Western Australia. The company's holds a 50% interest in the Ungani oil field located onshore in the Canning Basin. Buru Energy Limited was incorporated in 2008 and is based in West Perth, Australia.
| Metric | 2023 | 2022 | 2021 | 2020 | 2019 | 2018 | 2017 | 2016 | 2015 | 2014 | 2013 | 2012 | 2011 | 2010 |
|---|---|---|---|---|---|---|---|---|---|---|---|---|---|---|
| Revenue | 4.73M | 13.89M | 9.61M | 11.30M | 13.78M | 19.88M | 7.89M | 219.00K | 3.48M | 15.14M | 0.00 | 2.02M | 1.54M | 2.55M |
| Cost of Revenue | 4.53M | 8.01M | 5.02M | 7.85M | 6.21M | 10.42M | 4.22M | 1.45M | 5.29M | 11.12M | 0.00 | 2.31M | 1.75M | 2.29M |
| Gross Profit | 205.00K | 5.88M | 4.59M | 3.45M | 7.56M | 9.46M | 3.67M | -1.23M | -1.81M | 4.02M | 0.00 | -288.00K | -206.00K | 266.00K |
| Gross Profit Ratio | 4.33% | 42.35% | 47.75% | 30.56% | 54.90% | 47.59% | 46.48% | -560.27% | -51.95% | 26.56% | 0.00% | -14.26% | -13.35% | 10.42% |
| Research & Development | 0.00 | 0.00 | 0.00 | 0.00 | 0.00 | 0.00 | 0.00 | 0.00 | 0.00 | 0.00 | 0.00 | 0.00 | 0.00 | 0.00 |
| General & Administrative | 3.00M | 3.91M | 3.31M | 1.68M | 6.51M | 6.26M | 6.79M | 5.84M | 8.24M | 14.41M | 7.76M | 11.23M | 5.81M | 4.34M |
| Selling & Marketing | 0.00 | 0.00 | 0.00 | 0.00 | 0.00 | 0.00 | 0.00 | 0.00 | 0.00 | 0.00 | 0.00 | 0.00 | 0.00 | 0.00 |
| SG&A | 3.00M | 3.91M | 3.31M | 1.68M | 6.51M | 6.26M | 6.79M | 5.84M | 8.24M | 14.41M | 7.76M | 11.23M | 5.81M | 4.34M |
| Other Expenses | -2.79M | -41.00K | 127.00K | -9.00K | -149.00K | 36.31M | 4.80M | 80.00K | 580.00K | 1.95M | 114.00K | 5.21M | 5.14M | 75.00K |
| Operating Expenses | 205.00K | 37.88M | 16.88M | 32.88M | 36.30M | 16.85M | 14.25M | 34.44M | 42.57M | 39.51M | 17.27M | 15.36M | 17.98M | 7.43M |
| Cost & Expenses | 9.79M | 45.89M | 21.90M | 40.73M | 42.52M | 27.27M | 18.47M | 35.88M | 47.86M | 50.63M | 17.27M | 17.66M | 19.73M | 9.72M |
| Interest Income | 485.00K | 53.00K | 64.00K | 275.00K | 1.20M | 1.03M | 404.00K | 793.00K | 4.99M | 2.22M | 1.63M | 2.64M | 2.86M | 2.75M |
| Interest Expense | 178.00K | 0.00 | 0.00 | 86.00K | 225.00K | 375.00K | 1.51M | 1.22M | 0.00 | 0.00 | 0.00 | 0.00 | 458.00K | 50.00K |
| Depreciation & Amortization | 632.00K | 3.48M | 4.34M | 7.03M | 6.88M | 323.00K | 888.00K | 1.17M | 1.33M | 1.35M | 547.00K | 385.00K | 308.00K | 0.00 |
| EBITDA | -4.31M | -29.42M | -10.91M | -26.54M | -25.00M | 30.44M | -3.81M | -33.13M | -40.09M | -32.45M | -32.12M | -20.97M | -15.26M | -9.57M |
| EBITDA Ratio | -91.02% | -211.73% | -113.22% | -234.80% | -181.45% | 153.91% | -45.60% | -15,177.63% | -1,150.72% | -214.35% | 0.00% | -755.35% | -620.16% | -170.05% |
| Operating Income | -5.06M | -30.22M | -12.26M | -27.83M | -26.40M | 30.27M | -4.49M | -34.41M | -41.43M | -33.80M | -17.27M | -15.64M | -9.88M | -4.34M |
| Operating Income Ratio | -106.80% | -217.54% | -127.64% | -246.20% | -191.65% | 152.28% | -56.85% | -15,713.24% | -1,189.01% | -223.26% | 0.00% | -774.41% | -640.12% | -170.05% |
| Total Other Income/Expenses | -63.00K | 12.00K | 1.55M | 225.00K | 709.00K | 626.00K | -1.08M | -656.00K | 4.59M | 2.34M | 3.25M | 6.55M | 8.24M | -5.99M |
| Income Before Tax | -5.12M | -32.78M | -10.75M | -28.82M | -27.53M | 29.74M | -6.21M | -36.32M | -40.42M | -31.64M | -14.98M | -7.40M | -10.34M | -4.39M |
| Income Before Tax Ratio | -108.13% | -235.92% | -111.90% | -254.98% | -199.87% | 149.61% | -78.61% | -16,584.93% | -1,160.28% | -208.99% | 0.00% | -366.44% | -669.80% | -172.00% |
| Income Tax Expense | 0.00 | 739.00K | -1.42M | 77.00K | 76.00K | 36.68M | 6.31M | -1.04M | -3.37M | -1.89M | -2.18M | -1.90M | 5.60M | 0.00 |
| Net Income | -5.12M | -32.78M | -10.75M | -28.82M | -27.53M | 29.74M | -6.21M | -33.98M | -40.42M | -31.64M | -14.98M | -5.51M | -10.34M | -4.39M |
| Net Income Ratio | -108.13% | -235.92% | -111.90% | -254.98% | -199.87% | 149.61% | -78.61% | -15,516.89% | -1,160.28% | -208.99% | 0.00% | -272.57% | -669.80% | -172.00% |
| EPS | -0.01 | -0.06 | -0.02 | -0.07 | -0.06 | 0.07 | -0.02 | -0.10 | -0.12 | -0.10 | -0.05 | -0.02 | -0.06 | -0.02 |
| EPS Diluted | -0.01 | -0.06 | -0.02 | -0.07 | -0.06 | 0.07 | -0.02 | -0.10 | -0.12 | -0.10 | -0.05 | -0.02 | -0.06 | -0.02 |
| Weighted Avg Shares Out | 602.54M | 571.10M | 501.11M | 432.07M | 432.07M | 432.05M | 367.98M | 348.29M | 348.29M | 316.65M | 301.39M | 224.74M | 187.25M | 182.58M |
| Weighted Avg Shares Out (Dil) | 602.49M | 571.10M | 501.11M | 432.07M | 432.07M | 432.05M | 367.98M | 348.29M | 348.29M | 316.65M | 301.39M | 224.74M | 187.25M | 182.58M |
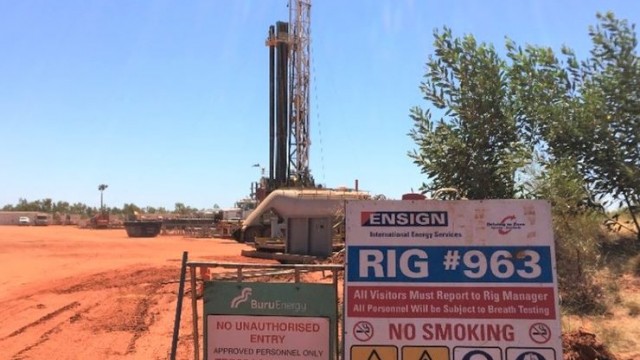
Buru Energy brings forward flow test of Rafael 1 well discovery
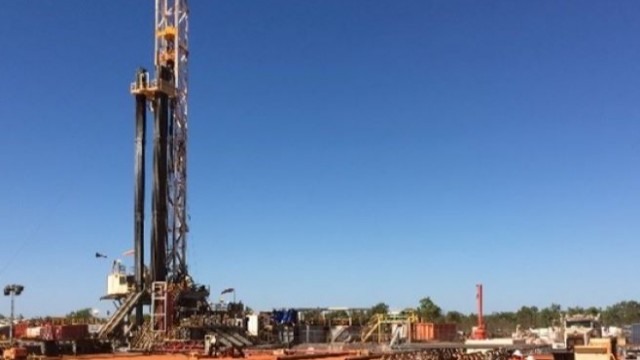
Buru Energy readies for all-important flow test of Rafael 1 discovery
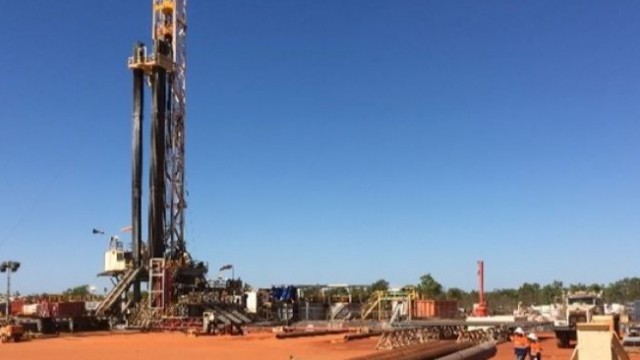
Buru Energy updates operations at Rafael 1 and Ungani 8H
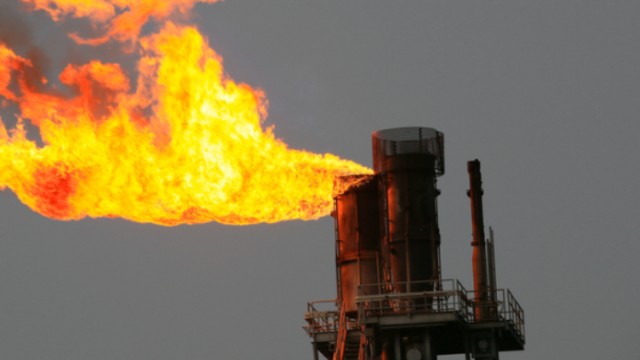
Buru Energy continues turning the drill bit at Canning Basin's Ungani 8H development well, shares rise
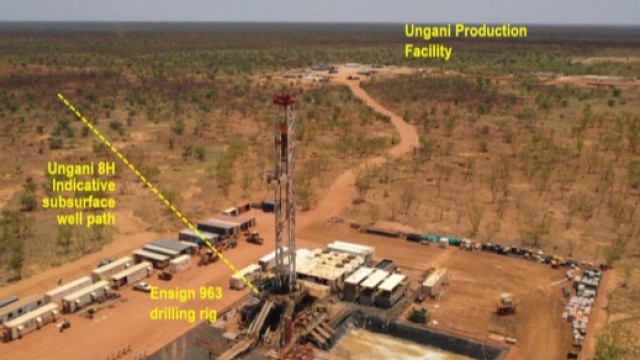
Buru Energy spuds Ungani 8H development well
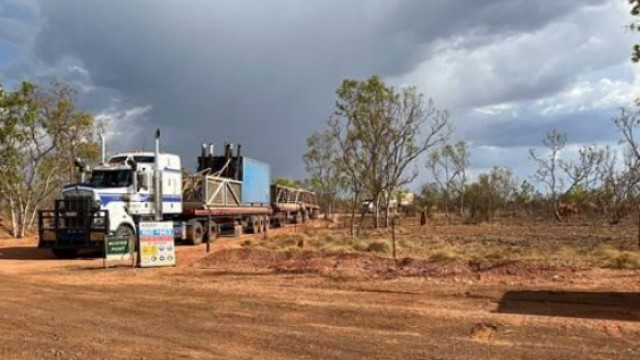
Buru Energy's Ungani Oilfield well 8H on track to be spudded later this week
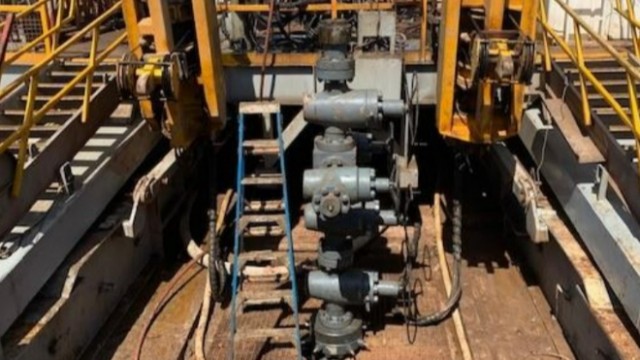
Buru Energy advances Rafael 1 well in Canning Basin toward production, Christmas tree installed
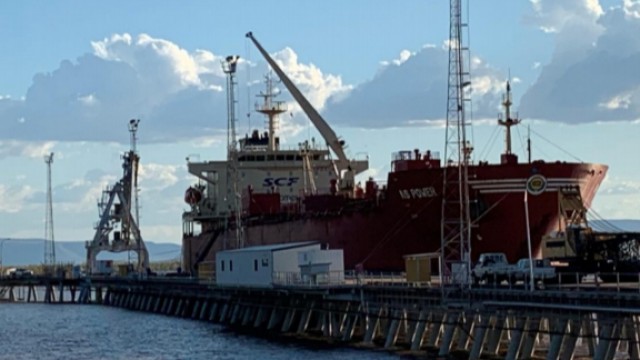
Buru Energy kicks off oil exploration program across the Canning Basin
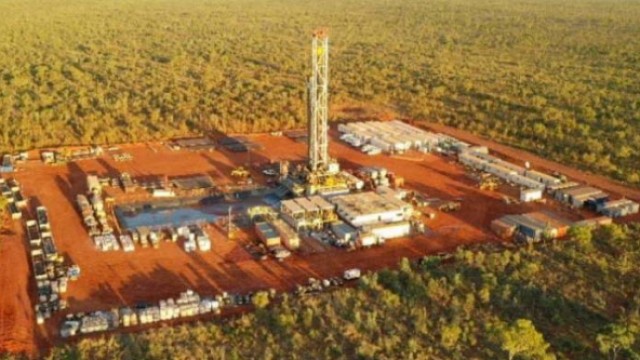
Buru Energy's Rafael 1 gas condensate discovery being prepared for production test
Buru Energy's Canning Basin Rafael 1 exploration well reaches final total depth of 4,141 metres with additional good to excellent gas shows over another 120 metres
Source: https://incomestatements.info
Category: Stock Reports
