See more : Cofina, SGPS, S.A. (CFN.LS) Income Statement Analysis – Financial Results
Complete financial analysis of Buru Energy Limited (BRNGF) income statement, including revenue, profit margins, EPS and key performance metrics. Get detailed insights into the financial performance of Buru Energy Limited, a leading company in the Oil & Gas Exploration & Production industry within the Energy sector.
- Enerflex Ltd. (EFX.TO) Income Statement Analysis – Financial Results
- Ready Capital Corporation (RCB) Income Statement Analysis – Financial Results
- SK Securities No.12 SPAC (473000.KQ) Income Statement Analysis – Financial Results
- Mangalam Industrial Finance Limited (MANGIND.BO) Income Statement Analysis – Financial Results
- TortoiseEcofin Acquisition Corp. III WT (TRTL-WT) Income Statement Analysis – Financial Results
Buru Energy Limited (BRNGF)
About Buru Energy Limited
Buru Energy Limited, together with its subsidiaries, engages in the exploration, development, and production of oil and gas resources in Western Australia. The company operates through Oil Production and Exploration segments. It holds interests in a portfolio of petroleum exploration permits covering an area of approximately 5.4 million gross acres located in Canning Basin in the southwest Kimberley region of Western Australia. The company's holds a 50% interest in the Ungani oil field located onshore in the Canning Basin. Buru Energy Limited was incorporated in 2008 and is based in West Perth, Australia.
| Metric | 2023 | 2022 | 2021 | 2020 | 2019 | 2018 | 2017 | 2016 | 2015 | 2014 | 2013 | 2012 | 2011 | 2010 |
|---|---|---|---|---|---|---|---|---|---|---|---|---|---|---|
| Revenue | 4.73M | 13.89M | 9.61M | 11.30M | 13.78M | 19.88M | 7.89M | 219.00K | 3.48M | 15.14M | 0.00 | 2.02M | 1.54M | 2.55M |
| Cost of Revenue | 4.53M | 8.01M | 5.02M | 7.85M | 6.21M | 10.42M | 4.22M | 1.45M | 5.29M | 11.12M | 0.00 | 2.31M | 1.75M | 2.29M |
| Gross Profit | 205.00K | 5.88M | 4.59M | 3.45M | 7.56M | 9.46M | 3.67M | -1.23M | -1.81M | 4.02M | 0.00 | -288.00K | -206.00K | 266.00K |
| Gross Profit Ratio | 4.33% | 42.35% | 47.75% | 30.56% | 54.90% | 47.59% | 46.48% | -560.27% | -51.95% | 26.56% | 0.00% | -14.26% | -13.35% | 10.42% |
| Research & Development | 0.00 | 0.00 | 0.00 | 0.00 | 0.00 | 0.00 | 0.00 | 0.00 | 0.00 | 0.00 | 0.00 | 0.00 | 0.00 | 0.00 |
| General & Administrative | 3.00M | 3.91M | 3.31M | 1.68M | 6.51M | 6.26M | 6.79M | 5.84M | 8.24M | 14.41M | 7.76M | 11.23M | 5.81M | 4.34M |
| Selling & Marketing | 0.00 | 0.00 | 0.00 | 0.00 | 0.00 | 0.00 | 0.00 | 0.00 | 0.00 | 0.00 | 0.00 | 0.00 | 0.00 | 0.00 |
| SG&A | 3.00M | 3.91M | 3.31M | 1.68M | 6.51M | 6.26M | 6.79M | 5.84M | 8.24M | 14.41M | 7.76M | 11.23M | 5.81M | 4.34M |
| Other Expenses | -2.79M | -41.00K | 127.00K | -9.00K | -149.00K | 36.31M | 4.80M | 80.00K | 580.00K | 1.95M | 114.00K | 5.21M | 5.14M | 75.00K |
| Operating Expenses | 205.00K | 37.88M | 16.88M | 32.88M | 36.30M | 16.85M | 14.25M | 34.44M | 42.57M | 39.51M | 17.27M | 15.36M | 17.98M | 7.43M |
| Cost & Expenses | 9.79M | 45.89M | 21.90M | 40.73M | 42.52M | 27.27M | 18.47M | 35.88M | 47.86M | 50.63M | 17.27M | 17.66M | 19.73M | 9.72M |
| Interest Income | 485.00K | 53.00K | 64.00K | 275.00K | 1.20M | 1.03M | 404.00K | 793.00K | 4.99M | 2.22M | 1.63M | 2.64M | 2.86M | 2.75M |
| Interest Expense | 178.00K | 0.00 | 0.00 | 86.00K | 225.00K | 375.00K | 1.51M | 1.22M | 0.00 | 0.00 | 0.00 | 0.00 | 458.00K | 50.00K |
| Depreciation & Amortization | 632.00K | 3.48M | 4.34M | 7.03M | 6.88M | 323.00K | 888.00K | 1.17M | 1.33M | 1.35M | 547.00K | 385.00K | 308.00K | 0.00 |
| EBITDA | -4.31M | -29.42M | -10.91M | -26.54M | -25.00M | 30.44M | -3.81M | -33.13M | -40.09M | -32.45M | -32.12M | -20.97M | -15.26M | -9.57M |
| EBITDA Ratio | -91.02% | -211.73% | -113.22% | -234.80% | -181.45% | 153.91% | -45.60% | -15,177.63% | -1,150.72% | -214.35% | 0.00% | -755.35% | -620.16% | -170.05% |
| Operating Income | -5.06M | -30.22M | -12.26M | -27.83M | -26.40M | 30.27M | -4.49M | -34.41M | -41.43M | -33.80M | -17.27M | -15.64M | -9.88M | -4.34M |
| Operating Income Ratio | -106.80% | -217.54% | -127.64% | -246.20% | -191.65% | 152.28% | -56.85% | -15,713.24% | -1,189.01% | -223.26% | 0.00% | -774.41% | -640.12% | -170.05% |
| Total Other Income/Expenses | -63.00K | 12.00K | 1.55M | 225.00K | 709.00K | 626.00K | -1.08M | -656.00K | 4.59M | 2.34M | 3.25M | 6.55M | 8.24M | -5.99M |
| Income Before Tax | -5.12M | -32.78M | -10.75M | -28.82M | -27.53M | 29.74M | -6.21M | -36.32M | -40.42M | -31.64M | -14.98M | -7.40M | -10.34M | -4.39M |
| Income Before Tax Ratio | -108.13% | -235.92% | -111.90% | -254.98% | -199.87% | 149.61% | -78.61% | -16,584.93% | -1,160.28% | -208.99% | 0.00% | -366.44% | -669.80% | -172.00% |
| Income Tax Expense | 0.00 | 739.00K | -1.42M | 77.00K | 76.00K | 36.68M | 6.31M | -1.04M | -3.37M | -1.89M | -2.18M | -1.90M | 5.60M | 0.00 |
| Net Income | -5.12M | -32.78M | -10.75M | -28.82M | -27.53M | 29.74M | -6.21M | -33.98M | -40.42M | -31.64M | -14.98M | -5.51M | -10.34M | -4.39M |
| Net Income Ratio | -108.13% | -235.92% | -111.90% | -254.98% | -199.87% | 149.61% | -78.61% | -15,516.89% | -1,160.28% | -208.99% | 0.00% | -272.57% | -669.80% | -172.00% |
| EPS | -0.01 | -0.06 | -0.02 | -0.07 | -0.06 | 0.07 | -0.02 | -0.10 | -0.12 | -0.10 | -0.05 | -0.02 | -0.06 | -0.02 |
| EPS Diluted | -0.01 | -0.06 | -0.02 | -0.07 | -0.06 | 0.07 | -0.02 | -0.10 | -0.12 | -0.10 | -0.05 | -0.02 | -0.06 | -0.02 |
| Weighted Avg Shares Out | 602.54M | 571.10M | 501.11M | 432.07M | 432.07M | 432.05M | 367.98M | 348.29M | 348.29M | 316.65M | 301.39M | 224.74M | 187.25M | 182.58M |
| Weighted Avg Shares Out (Dil) | 602.49M | 571.10M | 501.11M | 432.07M | 432.07M | 432.05M | 367.98M | 348.29M | 348.29M | 316.65M | 301.39M | 224.74M | 187.25M | 182.58M |
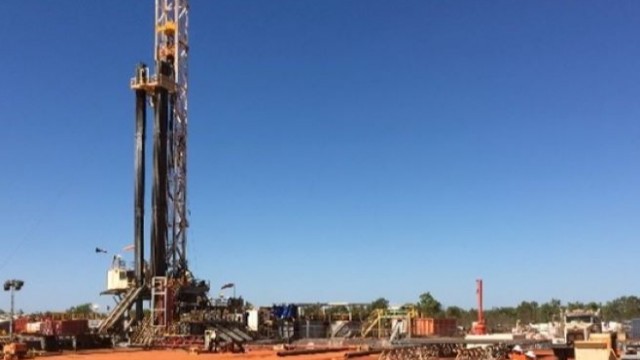
Buru Energy drilling ahead at Rafael after setting casing
Buru Energy encouraged by hydrocarbon indications at Rafael 1 well in Canning Basin
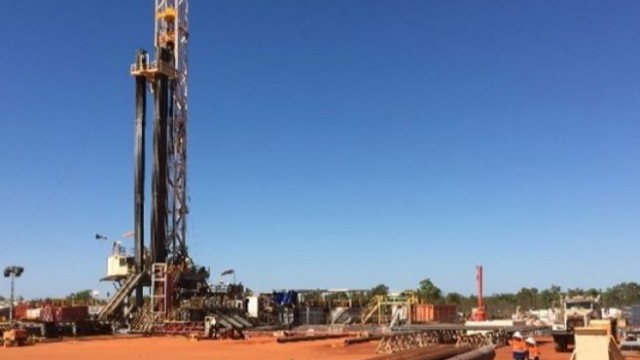
Buru Energy encounters early hydrocarbon shows above main reservoir target in Rafael 1 well

Buru Energy to receive circa A$3.7 million from latest lifting of Ungani crude

Buru Energy lifting from Ungani Oilfield coincides with very strong Brent oil prices
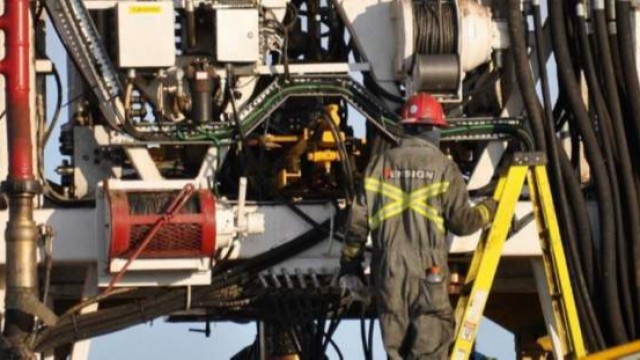
Buru Energy continues drilling at Rafael 1 Well in Canning Basin, WA
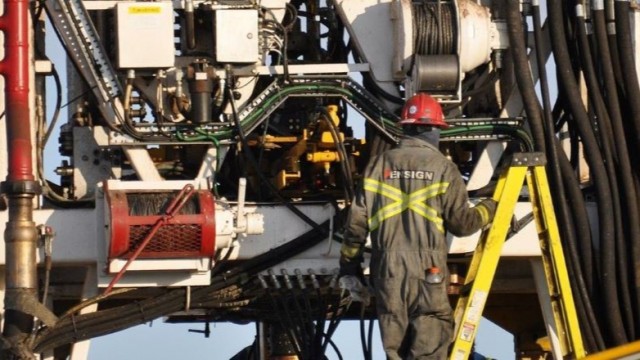
Buru Energy continues full steam ahead at Rafael 1 Well in WA's Canning Basin
Buru Energy spuds Rafael 1
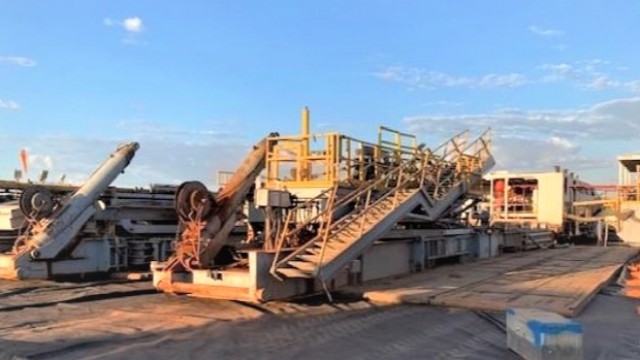
Buru Energy prepares to drill Rafael 1 well in Canning Basin
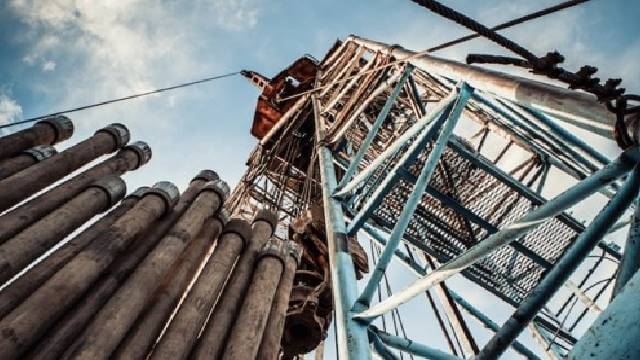
Buru Energy completes Currajong 1 drilling with rig being moved to Rafael 1
Source: https://incomestatements.info
Category: Stock Reports
