See more : Shengkai Innovations, Inc. (VALV) Income Statement Analysis – Financial Results
Complete financial analysis of Chalice Mining Limited (CGMLF) income statement, including revenue, profit margins, EPS and key performance metrics. Get detailed insights into the financial performance of Chalice Mining Limited, a leading company in the Industrial Materials industry within the Basic Materials sector.
- Geely Automobile Holdings Limited (GELYF) Income Statement Analysis – Financial Results
- CAREER CO., LTD. (6198.T) Income Statement Analysis – Financial Results
- Niagara Mohawk Power Corporation PFD 3.40% (NMPWP) Income Statement Analysis – Financial Results
- Glenville Bank Holding Company, Inc. (GLNV) Income Statement Analysis – Financial Results
- EVEXIA LIFECARE LIMITED (EVEXIA.BO) Income Statement Analysis – Financial Results
Chalice Mining Limited (CGMLF)
About Chalice Mining Limited
Chalice Mining Limited operates as a mineral exploration and evaluation company. The company explores for gold, copper, cobalt, palladium, platinum group element, and nickel deposits. Its flagship properties include the Julimar Nickel-Copper-Platinum group element project that covers an area of approximately 740 square kilometers located in Avon Region, Western Australia; and the Barrabarra Nickel -Copper- Platinum group element project located in Geraldton. It also holds interest in Hawkstone Nickel-Copper-Cobalt project located in Kimberley and South West Nickel-Copper- Platinum group element project located in Perth, Western Australia. Chalice Mining Limited was incorporated in 2005 and is based in West Perth, Australia.
| Metric | 2024 | 2023 | 2022 | 2021 | 2020 | 2019 | 2018 | 2017 | 2016 | 2015 | 2014 | 2013 | 2012 | 2011 | 2010 | 2009 | 2008 | 2007 | 2006 |
|---|---|---|---|---|---|---|---|---|---|---|---|---|---|---|---|---|---|---|---|
| Revenue | 118.00K | 181.00K | 179.00K | 520.00K | 453.00K | 308.44K | 762.60K | 429.48K | 338.46K | 608.26K | 108.00K | 175.28K | 0.00 | 0.00 | 125.00K | 0.00 | 0.00 | 350.00 | 48.87K |
| Cost of Revenue | 0.00 | 782.00K | 145.00K | -102.00K | 264.10K | 75.73K | 76.56K | 50.23K | 64.20K | 92.69K | 0.00 | 0.00 | 0.00 | 0.00 | 0.00 | 0.00 | 0.00 | 0.00 | 0.00 |
| Gross Profit | 118.00K | -601.00K | 34.00K | 622.00K | 188.90K | 232.71K | 686.04K | 379.25K | 274.26K | 515.57K | 108.00K | 175.28K | 0.00 | 0.00 | 125.00K | 0.00 | 0.00 | 350.00 | 48.87K |
| Gross Profit Ratio | 100.00% | -332.04% | 18.99% | 119.62% | 41.70% | 75.45% | 89.96% | 88.31% | 81.03% | 84.76% | 100.00% | 100.00% | 0.00% | 0.00% | 100.00% | 0.00% | 0.00% | 100.00% | 100.00% |
| Research & Development | 0.00 | 0.00 | 0.00 | 0.00 | 0.00 | 0.00 | 0.00 | 1.28M | 1.41M | 1.80M | 2.28M | 0.00 | 0.00 | 0.00 | 0.00 | 0.00 | 0.00 | 0.00 | 0.00 |
| General & Administrative | 5.57M | 6.83M | 3.18M | 9.61M | 3.16M | 3.54M | 2.89M | 3.03M | 1.92M | 2.77M | 2.58M | 2.25M | 1.94M | 2.41M | 3.44M | 1.18M | 828.37K | 1.31M | 369.78K |
| Selling & Marketing | 0.00 | 63.18M | 477.00K | 0.00 | 0.00 | 825.78K | 739.72K | 1.28M | 1.41M | 1.80M | 2.28M | 719.95K | 0.00 | 0.00 | 0.00 | 0.00 | 2.06K | 2.25K | 9.41K |
| SG&A | 5.57M | 70.01M | 3.18M | 9.61M | 3.16M | 3.54M | 2.89M | 3.03M | 1.92M | 2.77M | 2.58M | 2.25M | 1.94M | 2.41M | 3.44M | 1.18M | 830.43K | 1.32M | 379.19K |
| Other Expenses | 44.87M | 1.14M | 47.61M | 545.00K | 769.54K | 1.54M | -3.26M | 1.77M | 1.12M | 5.05M | -563.36K | 5.05M | 24.82K | 229.25K | -628.07K | 494.75K | 2.81M | 1.83M | 0.00 |
| Operating Expenses | 50.44M | 70.01M | 65.68M | 47.05M | 13.32M | 8.63M | 15.89M | 3.67M | 4.96M | 5.15M | 11.02M | 4.69M | 3.94M | 4.40M | 5.42M | 1.60M | 2.57M | 1.66M | 1.84M |
| Cost & Expenses | 50.44M | 70.79M | 65.83M | 46.95M | 13.32M | 8.63M | 15.89M | 3.67M | 4.96M | 3.95M | 4.26M | 3.72M | 3.81M | 4.40M | 4.25M | 1.47M | 2.57M | 1.66M | 1.84M |
| Interest Income | 5.04M | 2.88M | 146.00K | 178.00K | 49.21K | 362.08K | 559.43K | 273.10K | 136.01K | 482.51K | 104.20K | 198.86K | 197.77K | 383.52K | 347.77K | 545.10K | 488.48K | 199.91K | 105.31K |
| Interest Expense | 186.00K | 161.00K | 164.00K | 28.00K | 13.42K | 0.00 | 0.00 | 0.00 | 0.00 | 0.00 | 0.00 | 0.00 | 0.00 | 0.00 | 0.00 | 0.00 | 64.00 | 2.78K | 295.00 |
| Depreciation & Amortization | 182.00K | 782.00K | 671.00K | 274.00K | 264.10K | 75.73K | 76.56K | 50.23K | 64.20K | 92.69K | 93.46K | 83.45K | 99.45K | 474.33K | 264.79K | 71.54K | 74.21K | 56.46K | 12.20K |
| EBITDA | -44.25M | -66.39M | -64.85M | -46.27M | -11.69M | -8.21M | -5.79M | -3.62M | -4.10M | -5.06M | -10.92M | -3.92M | -3.84M | -3.89M | -5.03M | -1.53M | 807.02K | -1.13M | -1.68M |
| EBITDA Ratio | -37,502.54% | -38,679.56% | -36,578.77% | -9,006.54% | -2,882.01% | -2,772.19% | -2,070.45% | -620.57% | -1,212.13% | -876.62% | -10,113.94% | -2,234.46% | 0.00% | 0.00% | -4,023.42% | 0.00% | 0.00% | 123,255.71% | -3,427.87% |
| Operating Income | -50.44M | -70.79M | -65.65M | -46.95M | -13.32M | -8.63M | -15.87M | -2.91M | -2.42M | -3.34M | -4.26M | -3.72M | -3.81M | -4.40M | -4.25M | -1.47M | 732.80K | 374.94K | -1.69M |
| Operating Income Ratio | -42,749.15% | -39,111.60% | -36,675.98% | -9,029.23% | -2,940.31% | -2,796.74% | -2,080.49% | -676.61% | -714.22% | -548.83% | -3,942.46% | -2,119.91% | 0.00% | 0.00% | -3,397.60% | 0.00% | 0.00% | 107,124.86% | -3,452.83% |
| Total Other Income/Expenses | 5.82M | 4.04M | 47.14M | -2.43M | -825.00K | 1.52M | -3.71M | 262.06K | -2.09M | 3.94M | -7.43M | 4.32M | 96.16K | 573.15K | -1.33M | 909.99K | 2.04K | 2.03M | -295.00 |
| Income Before Tax | -44.62M | -66.76M | -18.06M | -46.26M | -12.51M | -6.72M | -18.76M | -2.64M | -4.44M | 604.02K | -11.49M | -124.88K | -3.72M | -3.83M | -5.58M | -564.54K | 734.85K | -1.19M | -1.69M |
| Income Before Tax Ratio | -37,814.41% | -36,881.77% | -10,088.83% | -8,895.58% | -2,762.53% | -2,178.59% | -2,459.83% | -615.59% | -1,312.48% | 99.30% | -10,639.60% | -71.25% | 0.00% | 0.00% | -4,460.70% | 0.00% | 0.00% | -339,278.86% | -3,453.43% |
| Income Tax Expense | -5.12M | -1.15M | 246.00K | -3.06M | -1.11M | 49.25K | -2.81M | -361.99K | -182.38K | 259.53K | -259.53K | -43.30M | 177.08K | -342.39K | -347.77K | -545.10K | 2.81M | 1.84M | 0.00 |
| Net Income | -39.50M | -65.60M | -18.31M | -43.19M | -2.66M | -10.17M | -15.95M | -2.28M | 7.43M | 355.45K | -11.56M | 43.66M | -4.09M | -3.83M | -5.58M | -564.54K | 734.85K | -1.19M | -1.69M |
| Net Income Ratio | -33,472.88% | -36,244.20% | -10,226.26% | -8,306.35% | -587.05% | -3,296.09% | -2,091.43% | -531.31% | 2,196.01% | 58.44% | -10,703.39% | 24,911.49% | 0.00% | 0.00% | -4,460.70% | 0.00% | 0.00% | -339,278.86% | -3,453.43% |
| EPS | -0.10 | -0.17 | -0.05 | -0.13 | -0.01 | -0.04 | -0.06 | -0.01 | 0.03 | 0.00 | -0.04 | 0.17 | -0.02 | -0.02 | -0.04 | -0.01 | 0.01 | -0.02 | -0.06 |
| EPS Diluted | -0.10 | -0.17 | -0.05 | -0.13 | -0.01 | -0.04 | -0.06 | -0.01 | 0.03 | 0.00 | -0.04 | 0.17 | -0.02 | -0.02 | -0.04 | -0.01 | 0.01 | -0.02 | -0.06 |
| Weighted Avg Shares Out | 379.26M | 377.46M | 355.10M | 327.18M | 277.06M | 265.94M | 261.21M | 267.71M | 282.71M | 285.00M | 268.15M | 250.44M | 250.03M | 209.47M | 135.87M | 73.92M | 73.92M | 73.92M | 28.72M |
| Weighted Avg Shares Out (Dil) | 379.26M | 377.46M | 355.10M | 327.18M | 277.06M | 265.94M | 261.21M | 267.71M | 282.71M | 285.00M | 268.15M | 250.44M | 250.03M | 209.47M | 135.87M | 73.92M | 73.92M | 73.92M | 28.72M |
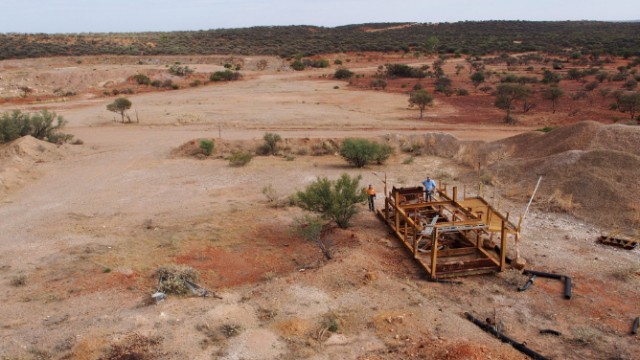
Krakatoa Resources identifies multiple conductors with VTEM surveying over Mt Clere Project
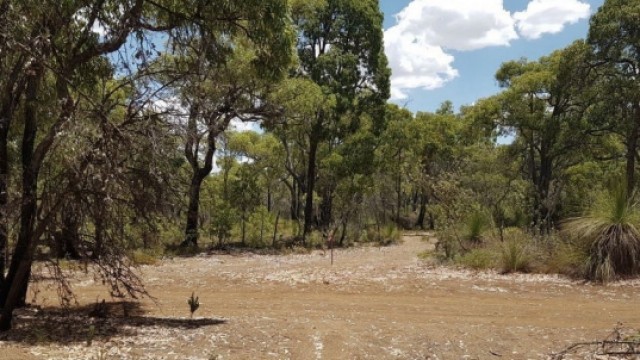
Chalice Mining kicks off first ever exploration drilling at Hartog Target within Julimar State Forest

Chalice Mining granted access approval for low-impact drilling at Julimar targets
Chalice Mining makes new discovery at iconic Julimar property
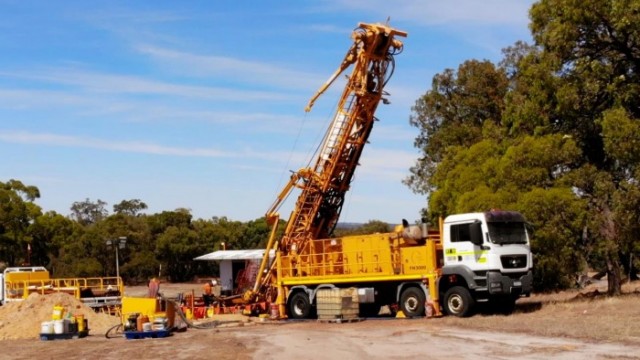
Chalice Mining soars to new heights thanks to record-breaking maiden mineral resource at Gonneville

Chalice Mining founder and chair Tim Goyder to pass on the baton after 15 years at the helm

Chalice Mining strengthens board with appointment of Linda Kenyon as independent non-executive director
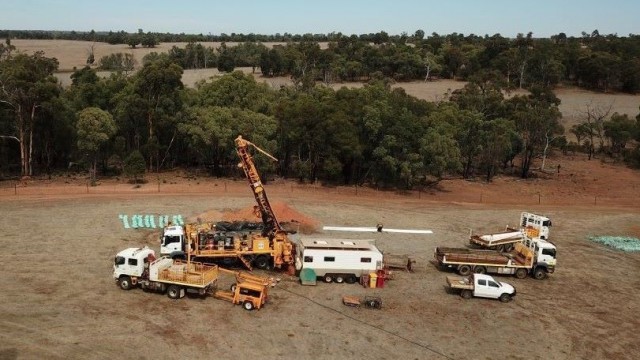
Chalice Minings' Gonneville intrusion at Julimar Nickel-Copper-PGE Project continues to take shape as world-class, strategic deposit

Chalice Mining moves to demerge gold assets
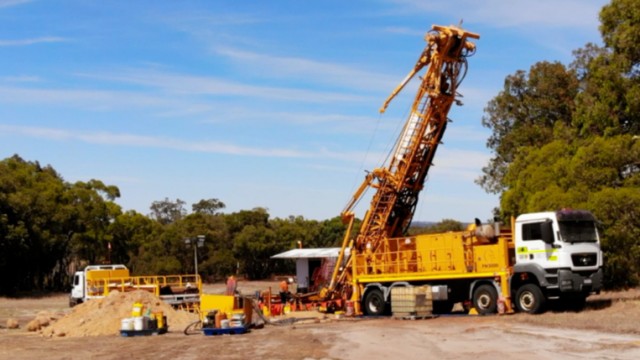
Chalice Mining continues to unlock Julimar potential as resource drilling hits continuous high-grade zones
Source: https://incomestatements.info
Category: Stock Reports
