See more : Safari Industries (India) Limited (SAFARIND.BO) Income Statement Analysis – Financial Results
Complete financial analysis of Chalice Mining Limited (CGMLF) income statement, including revenue, profit margins, EPS and key performance metrics. Get detailed insights into the financial performance of Chalice Mining Limited, a leading company in the Industrial Materials industry within the Basic Materials sector.
- Trevali Mining Corporation (TV.TO) Income Statement Analysis – Financial Results
- Rogers Communications Inc. (RCI-A.TO) Income Statement Analysis – Financial Results
- China TechFaith Wireless Communication Technology Limited (CNTFY) Income Statement Analysis – Financial Results
- Dohwa Engineering Co., Ltd. (002150.KS) Income Statement Analysis – Financial Results
- Spirit of Texas Bancshares, Inc. (STXB) Income Statement Analysis – Financial Results
Chalice Mining Limited (CGMLF)
About Chalice Mining Limited
Chalice Mining Limited operates as a mineral exploration and evaluation company. The company explores for gold, copper, cobalt, palladium, platinum group element, and nickel deposits. Its flagship properties include the Julimar Nickel-Copper-Platinum group element project that covers an area of approximately 740 square kilometers located in Avon Region, Western Australia; and the Barrabarra Nickel -Copper- Platinum group element project located in Geraldton. It also holds interest in Hawkstone Nickel-Copper-Cobalt project located in Kimberley and South West Nickel-Copper- Platinum group element project located in Perth, Western Australia. Chalice Mining Limited was incorporated in 2005 and is based in West Perth, Australia.
| Metric | 2024 | 2023 | 2022 | 2021 | 2020 | 2019 | 2018 | 2017 | 2016 | 2015 | 2014 | 2013 | 2012 | 2011 | 2010 | 2009 | 2008 | 2007 | 2006 |
|---|---|---|---|---|---|---|---|---|---|---|---|---|---|---|---|---|---|---|---|
| Revenue | 118.00K | 181.00K | 179.00K | 520.00K | 453.00K | 308.44K | 762.60K | 429.48K | 338.46K | 608.26K | 108.00K | 175.28K | 0.00 | 0.00 | 125.00K | 0.00 | 0.00 | 350.00 | 48.87K |
| Cost of Revenue | 0.00 | 782.00K | 145.00K | -102.00K | 264.10K | 75.73K | 76.56K | 50.23K | 64.20K | 92.69K | 0.00 | 0.00 | 0.00 | 0.00 | 0.00 | 0.00 | 0.00 | 0.00 | 0.00 |
| Gross Profit | 118.00K | -601.00K | 34.00K | 622.00K | 188.90K | 232.71K | 686.04K | 379.25K | 274.26K | 515.57K | 108.00K | 175.28K | 0.00 | 0.00 | 125.00K | 0.00 | 0.00 | 350.00 | 48.87K |
| Gross Profit Ratio | 100.00% | -332.04% | 18.99% | 119.62% | 41.70% | 75.45% | 89.96% | 88.31% | 81.03% | 84.76% | 100.00% | 100.00% | 0.00% | 0.00% | 100.00% | 0.00% | 0.00% | 100.00% | 100.00% |
| Research & Development | 0.00 | 0.00 | 0.00 | 0.00 | 0.00 | 0.00 | 0.00 | 1.28M | 1.41M | 1.80M | 2.28M | 0.00 | 0.00 | 0.00 | 0.00 | 0.00 | 0.00 | 0.00 | 0.00 |
| General & Administrative | 5.57M | 6.83M | 3.18M | 9.61M | 3.16M | 3.54M | 2.89M | 3.03M | 1.92M | 2.77M | 2.58M | 2.25M | 1.94M | 2.41M | 3.44M | 1.18M | 828.37K | 1.31M | 369.78K |
| Selling & Marketing | 0.00 | 63.18M | 477.00K | 0.00 | 0.00 | 825.78K | 739.72K | 1.28M | 1.41M | 1.80M | 2.28M | 719.95K | 0.00 | 0.00 | 0.00 | 0.00 | 2.06K | 2.25K | 9.41K |
| SG&A | 5.57M | 70.01M | 3.18M | 9.61M | 3.16M | 3.54M | 2.89M | 3.03M | 1.92M | 2.77M | 2.58M | 2.25M | 1.94M | 2.41M | 3.44M | 1.18M | 830.43K | 1.32M | 379.19K |
| Other Expenses | 44.87M | 1.14M | 47.61M | 545.00K | 769.54K | 1.54M | -3.26M | 1.77M | 1.12M | 5.05M | -563.36K | 5.05M | 24.82K | 229.25K | -628.07K | 494.75K | 2.81M | 1.83M | 0.00 |
| Operating Expenses | 50.44M | 70.01M | 65.68M | 47.05M | 13.32M | 8.63M | 15.89M | 3.67M | 4.96M | 5.15M | 11.02M | 4.69M | 3.94M | 4.40M | 5.42M | 1.60M | 2.57M | 1.66M | 1.84M |
| Cost & Expenses | 50.44M | 70.79M | 65.83M | 46.95M | 13.32M | 8.63M | 15.89M | 3.67M | 4.96M | 3.95M | 4.26M | 3.72M | 3.81M | 4.40M | 4.25M | 1.47M | 2.57M | 1.66M | 1.84M |
| Interest Income | 5.04M | 2.88M | 146.00K | 178.00K | 49.21K | 362.08K | 559.43K | 273.10K | 136.01K | 482.51K | 104.20K | 198.86K | 197.77K | 383.52K | 347.77K | 545.10K | 488.48K | 199.91K | 105.31K |
| Interest Expense | 186.00K | 161.00K | 164.00K | 28.00K | 13.42K | 0.00 | 0.00 | 0.00 | 0.00 | 0.00 | 0.00 | 0.00 | 0.00 | 0.00 | 0.00 | 0.00 | 64.00 | 2.78K | 295.00 |
| Depreciation & Amortization | 182.00K | 782.00K | 671.00K | 274.00K | 264.10K | 75.73K | 76.56K | 50.23K | 64.20K | 92.69K | 93.46K | 83.45K | 99.45K | 474.33K | 264.79K | 71.54K | 74.21K | 56.46K | 12.20K |
| EBITDA | -44.25M | -66.39M | -64.85M | -46.27M | -11.69M | -8.21M | -5.79M | -3.62M | -4.10M | -5.06M | -10.92M | -3.92M | -3.84M | -3.89M | -5.03M | -1.53M | 807.02K | -1.13M | -1.68M |
| EBITDA Ratio | -37,502.54% | -38,679.56% | -36,578.77% | -9,006.54% | -2,882.01% | -2,772.19% | -2,070.45% | -620.57% | -1,212.13% | -876.62% | -10,113.94% | -2,234.46% | 0.00% | 0.00% | -4,023.42% | 0.00% | 0.00% | 123,255.71% | -3,427.87% |
| Operating Income | -50.44M | -70.79M | -65.65M | -46.95M | -13.32M | -8.63M | -15.87M | -2.91M | -2.42M | -3.34M | -4.26M | -3.72M | -3.81M | -4.40M | -4.25M | -1.47M | 732.80K | 374.94K | -1.69M |
| Operating Income Ratio | -42,749.15% | -39,111.60% | -36,675.98% | -9,029.23% | -2,940.31% | -2,796.74% | -2,080.49% | -676.61% | -714.22% | -548.83% | -3,942.46% | -2,119.91% | 0.00% | 0.00% | -3,397.60% | 0.00% | 0.00% | 107,124.86% | -3,452.83% |
| Total Other Income/Expenses | 5.82M | 4.04M | 47.14M | -2.43M | -825.00K | 1.52M | -3.71M | 262.06K | -2.09M | 3.94M | -7.43M | 4.32M | 96.16K | 573.15K | -1.33M | 909.99K | 2.04K | 2.03M | -295.00 |
| Income Before Tax | -44.62M | -66.76M | -18.06M | -46.26M | -12.51M | -6.72M | -18.76M | -2.64M | -4.44M | 604.02K | -11.49M | -124.88K | -3.72M | -3.83M | -5.58M | -564.54K | 734.85K | -1.19M | -1.69M |
| Income Before Tax Ratio | -37,814.41% | -36,881.77% | -10,088.83% | -8,895.58% | -2,762.53% | -2,178.59% | -2,459.83% | -615.59% | -1,312.48% | 99.30% | -10,639.60% | -71.25% | 0.00% | 0.00% | -4,460.70% | 0.00% | 0.00% | -339,278.86% | -3,453.43% |
| Income Tax Expense | -5.12M | -1.15M | 246.00K | -3.06M | -1.11M | 49.25K | -2.81M | -361.99K | -182.38K | 259.53K | -259.53K | -43.30M | 177.08K | -342.39K | -347.77K | -545.10K | 2.81M | 1.84M | 0.00 |
| Net Income | -39.50M | -65.60M | -18.31M | -43.19M | -2.66M | -10.17M | -15.95M | -2.28M | 7.43M | 355.45K | -11.56M | 43.66M | -4.09M | -3.83M | -5.58M | -564.54K | 734.85K | -1.19M | -1.69M |
| Net Income Ratio | -33,472.88% | -36,244.20% | -10,226.26% | -8,306.35% | -587.05% | -3,296.09% | -2,091.43% | -531.31% | 2,196.01% | 58.44% | -10,703.39% | 24,911.49% | 0.00% | 0.00% | -4,460.70% | 0.00% | 0.00% | -339,278.86% | -3,453.43% |
| EPS | -0.10 | -0.17 | -0.05 | -0.13 | -0.01 | -0.04 | -0.06 | -0.01 | 0.03 | 0.00 | -0.04 | 0.17 | -0.02 | -0.02 | -0.04 | -0.01 | 0.01 | -0.02 | -0.06 |
| EPS Diluted | -0.10 | -0.17 | -0.05 | -0.13 | -0.01 | -0.04 | -0.06 | -0.01 | 0.03 | 0.00 | -0.04 | 0.17 | -0.02 | -0.02 | -0.04 | -0.01 | 0.01 | -0.02 | -0.06 |
| Weighted Avg Shares Out | 379.26M | 377.46M | 355.10M | 327.18M | 277.06M | 265.94M | 261.21M | 267.71M | 282.71M | 285.00M | 268.15M | 250.44M | 250.03M | 209.47M | 135.87M | 73.92M | 73.92M | 73.92M | 28.72M |
| Weighted Avg Shares Out (Dil) | 379.26M | 377.46M | 355.10M | 327.18M | 277.06M | 265.94M | 261.21M | 267.71M | 282.71M | 285.00M | 268.15M | 250.44M | 250.03M | 209.47M | 135.87M | 73.92M | 73.92M | 73.92M | 28.72M |
Anson Resources granted The Bull Nickel-Copper-PGE Project tenement
Chalice Mining identifies extensive nickel-copper soil anomalism at northern end of Julimar Complex

Carnavale Resources gains a strong mix of exploration and corporate skills with appointment of new CEO
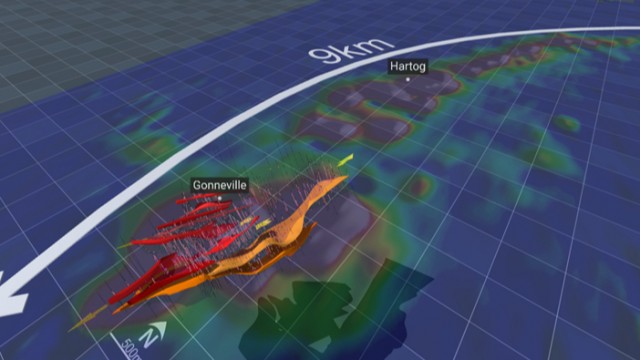
Chalice Mining releases interactive 3D model for Julimar Complex
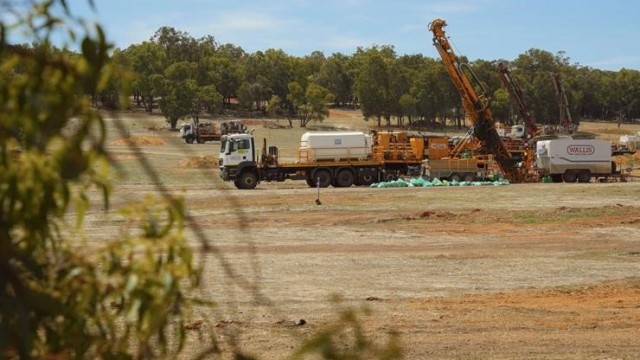
Chalice Mining's Julimar discovery continues to grow as drilling expands high-grade zones
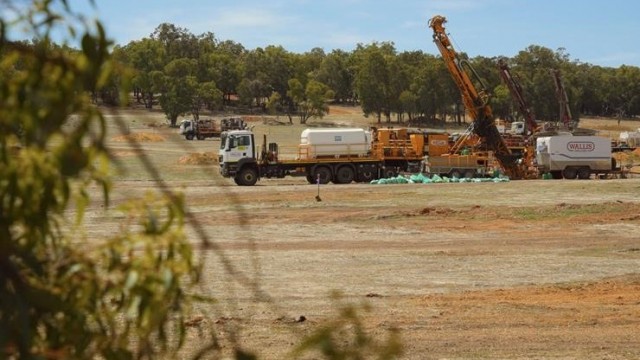
Chalice Mining secures key properties covering all known Gonneville Intrusion mineralisation

Chalice Mining finds more highly prospective EM conductors and nickel-copper soil anomalies at Julimar Project

Chalice Mining appoints sustainability expert Dr Soolim Carney as Environment and Community general manager

Chalice Mining bolsters board with appointment of highly regarded former Rio Tinto executive Stephen McIntosh
Source: https://incomestatements.info
Category: Stock Reports
