See more : Asetek A/S (0QDT.L) Income Statement Analysis – Financial Results
Complete financial analysis of Copper Mountain Mining Corporation (CPPMF) income statement, including revenue, profit margins, EPS and key performance metrics. Get detailed insights into the financial performance of Copper Mountain Mining Corporation, a leading company in the Copper industry within the Basic Materials sector.
- BurgerFi International, LLC (BFIIW) Income Statement Analysis – Financial Results
- GHST World Inc. (GHST) Income Statement Analysis – Financial Results
- Superior Group of Companies, Inc. (SGC) Income Statement Analysis – Financial Results
- Azevedo & Travassos S.A. (AZEV3.SA) Income Statement Analysis – Financial Results
- Hokkan Holdings Limited (5902.T) Income Statement Analysis – Financial Results
Copper Mountain Mining Corporation (CPPMF)
About Copper Mountain Mining Corporation
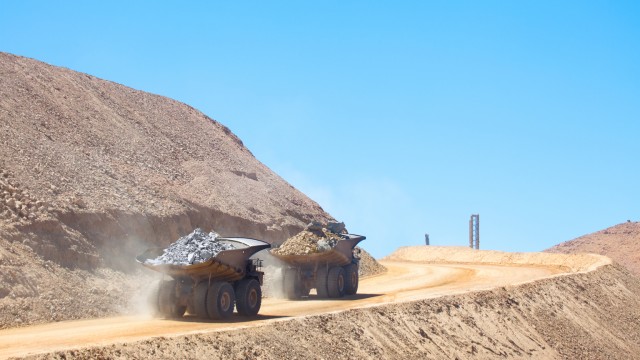
Copper Mountain Mining Corporation operates as a mining company in Canada. The company explores for copper, gold, and silver deposits. Its flagship asset is the Copper Mountain mine that comprise 138 crown granted mineral claims, 149 located mineral claims, 14 mining leases, and 12 fee simple properties covering an area of 6,702 hectares located to the south of Princeton, British Columbia. The company was founded in 2006 and is headquartered in Vancouver, Canada.
| Metric | 2022 | 2021 | 2020 | 2019 |
|---|---|---|---|---|
| Revenue | 301.47M | 578.20M | 341.75M | 288.46M |
| Cost of Revenue | 312.72M | 257.32M | 237.11M | 263.36M |
| Gross Profit | -11.25M | 320.88M | 104.64M | 25.10M |
| Gross Profit Ratio | -3.73% | 55.50% | 30.62% | 8.70% |
| Research & Development | 0.00 | 0.00 | 0.00 | 0.00 |
| General & Administrative | 14.23M | 31.67M | 14.05M | 13.64M |
| Selling & Marketing | 0.00 | 0.00 | 0.00 | 0.00 |
| SG&A | 14.23M | 31.67M | 14.05M | 13.64M |
| Other Expenses | 0.00 | 0.00 | 0.00 | 0.00 |
| Operating Expenses | 14.23M | 31.67M | 14.05M | 13.64M |
| Cost & Expenses | 326.95M | 288.99M | 251.15M | 277.00M |
| Interest Income | 597.00K | 177.00K | 632.00K | 1.21M |
| Interest Expense | 30.14M | 26.21M | 12.59M | 14.87M |
| Depreciation & Amortization | 25.90M | 23.82M | 22.75M | 27.53M |
| EBITDA | -2.48M | 307.84M | 112.34M | 38.56M |
| EBITDA Ratio | -0.82% | 53.24% | 32.87% | 13.37% |
| Operating Income | -25.48M | 289.21M | 90.60M | 11.03M |
| Operating Income Ratio | -8.45% | 50.02% | 26.51% | 3.82% |
| Total Other Income/Expenses | -42.84M | -37.93M | -9.05M | -50.15M |
| Income Before Tax | -68.32M | 251.28M | 81.55M | -39.12M |
| Income Before Tax Ratio | -22.66% | 43.46% | 23.86% | -13.56% |
| Income Tax Expense | -9.47M | 103.14M | 31.28M | -13.18M |
| Net Income | -58.85M | 148.14M | 50.26M | -25.94M |
| Net Income Ratio | -19.52% | 25.62% | 14.71% | -8.99% |
| EPS | -0.28 | 0.71 | 0.26 | -0.14 |
| EPS Diluted | -0.27 | 0.68 | 0.25 | -0.14 |
| Weighted Avg Shares Out | 212.84M | 209.32M | 193.12M | 189.53M |
| Weighted Avg Shares Out (Dil) | 218.13M | 218.62M | 197.66M | 191.00M |

Coppernico Commences Trading on the OTCQB Market Under Symbol CPPMF

Rush Rare Metals Updates Regarding Newly Discovered Historical High-Grade Intervals and Other Insights at Copper Mountain

Copper Mountain Mining Corporation (CPPMF) Q1 2023 Earnings Call Transcript

Copper Mountain Mining stock climbs on takeover deal with Hudbay Minerals

Copper Mountain Mining Announces First Quarter 2023 Results Conference Call Date

Copper Mountain Mining shares pop on big production outlook for 2023

Why Copper Mountain Mining Could Perform Well

Copper Mountain resumes production after ransomware attack

Copper Mountain Mining Corporation (CPPMF) Q3 2022 Earnings Call Transcript

Copper Mountain Mining: The Eva Project Sale Opens The Way For A New Acquisition
Source: https://incomestatements.info
Category: Stock Reports
