See more : EBOS Group Limited (EBO.AX) Income Statement Analysis – Financial Results
Complete financial analysis of Embark Technology, Inc. (EMBK) income statement, including revenue, profit margins, EPS and key performance metrics. Get detailed insights into the financial performance of Embark Technology, Inc., a leading company in the Software – Application industry within the Technology sector.
- Shin Poong Pharm.Co.,Ltd. (019175.KS) Income Statement Analysis – Financial Results
- Lahoti Overseas Limited (LAHOTIOV.BO) Income Statement Analysis – Financial Results
- Hunter Maritime Acquisition Corp. (HUNTF) Income Statement Analysis – Financial Results
- Toubani Resources Inc. (TRE.AX) Income Statement Analysis – Financial Results
- Kidoz Inc. (KIDZ.V) Income Statement Analysis – Financial Results
Embark Technology, Inc. (EMBK)
About Embark Technology, Inc.
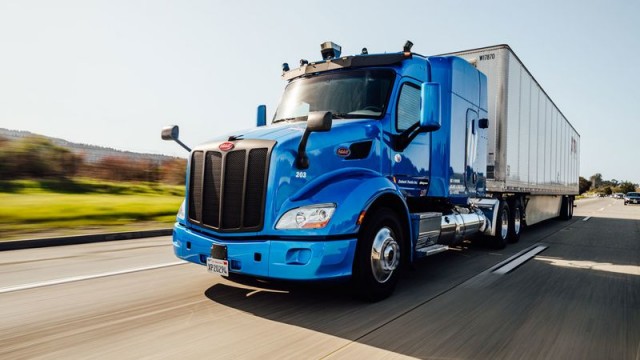
Embark Technology, Inc. develops self-driving software solutions for the trucking industry in the United States. Its solutions include Embark Driver, an autonomous trucking software; Embark Universal Interface, an interoperable self-driving stack that works across truck OEM platforms; and Embark Guardian, a cloud-based autonomous fleet management solution that gives carriers control over air updates, remote vehicle monitoring, remote vehicle assist, dispatching and access to real time data, such as weather and construction. The company was incorporated in 2016 and is headquartered in San Francisco, California.
| Metric | 2022 | 2021 | 2020 |
|---|---|---|---|
| Revenue | 0.00 | 0.00 | 0.00 |
| Cost of Revenue | 0.00 | 0.00 | 0.00 |
| Gross Profit | 0.00 | 0.00 | 0.00 |
| Gross Profit Ratio | 0.00% | 0.00% | 0.00% |
| Research & Development | 79.21M | 55.28M | 18.83M |
| General & Administrative | 74.45M | 48.39M | 3.60M |
| Selling & Marketing | 0.00 | 0.00 | 0.00 |
| SG&A | 74.45M | 48.39M | 3.60M |
| Other Expenses | -318.00K | -12.49M | 107.00K |
| Operating Expenses | 153.66M | 103.66M | 22.43M |
| Cost & Expenses | 153.66M | 103.66M | 22.43M |
| Interest Income | 2.22M | 98.00K | 788.00K |
| Interest Expense | 360.00K | 8.16M | 0.00 |
| Depreciation & Amortization | 6.98M | -11.31M | 1.72M |
| EBITDA | -146.69M | -114.98M | -20.71M |
| EBITDA Ratio | 0.00% | 0.00% | 0.00% |
| Operating Income | -153.66M | -103.66M | -22.43M |
| Operating Income Ratio | 0.00% | 0.00% | 0.00% |
| Total Other Income/Expenses | 50.50M | -20.55M | 895.00K |
| Income Before Tax | -103.16M | -124.21M | -21.53M |
| Income Before Tax Ratio | 0.00% | 0.00% | 0.00% |
| Income Tax Expense | -48.96M | -4.32M | 107.00K |
| Net Income | -54.21M | -119.89M | -21.64M |
| Net Income Ratio | 0.00% | 0.00% | 0.00% |
| EPS | -2.36 | -12.94 | -0.96 |
| EPS Diluted | -2.36 | -12.94 | -0.96 |
| Weighted Avg Shares Out | 23.00M | 9.27M | 22.48M |
| Weighted Avg Shares Out (Dil) | 23.00M | 9.27M | 22.48M |

Calling All Embark Trucks Inc. (EMBK) Investors: Contact Bronstein, Gewirtz & Grossman, LLC To Claim Your Losses

Calling All Embark Trucks Inc. (EMBK) Investors: Contact Bronstein, Gewirtz & Grossman, LLC To Claim Your Losses

Pomerantz LLP Announces Proposed Class Action Settlement on Behalf of Purchasers of Northern Genesis Acquisition Corp. II and Embark Technology, Inc. Common Stock

Embark Technology goes private in $71M deal

Self-driving truck startup Embark says it may go bust, shares plunge 33%

Embark shares tank as autonomous trucking firm mulls 'shutting down completely'

Embark Layoffs 2023: What to Know About the Latest EMBK Job Cuts

Embark Technology: Leading Player In The Race To Autonomous Trucking

The 7 Most Sold-Off Stocks of 2022

Embark Technology, Inc. (EMBK) Q3 2022 Earnings Call Transcript
Source: https://incomestatements.info
Category: Stock Reports
