See more : Tang Palace (China) Holdings Limited (TNGPF) Income Statement Analysis – Financial Results
Complete financial analysis of Embark Technology, Inc. (EMBK) income statement, including revenue, profit margins, EPS and key performance metrics. Get detailed insights into the financial performance of Embark Technology, Inc., a leading company in the Software – Application industry within the Technology sector.
- Luxxfolio Holdings Inc. (LUXFF) Income Statement Analysis – Financial Results
- IKK Holdings Inc . (2198.T) Income Statement Analysis – Financial Results
- AGF Management Limited (AGF-B.TO) Income Statement Analysis – Financial Results
- Globe Textiles (India) Limited (GLOBE.NS) Income Statement Analysis – Financial Results
- Ready Capital Corporation (RC) Income Statement Analysis – Financial Results
Embark Technology, Inc. (EMBK)
About Embark Technology, Inc.
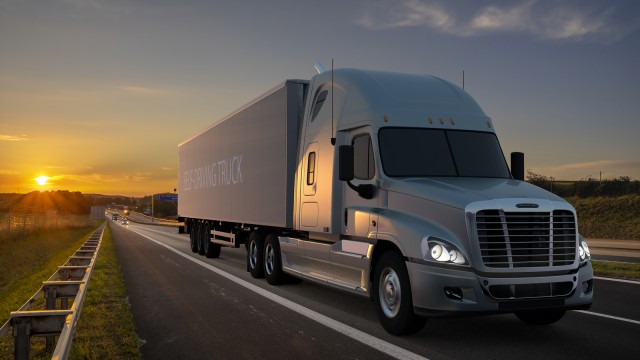
Embark Technology, Inc. develops self-driving software solutions for the trucking industry in the United States. Its solutions include Embark Driver, an autonomous trucking software; Embark Universal Interface, an interoperable self-driving stack that works across truck OEM platforms; and Embark Guardian, a cloud-based autonomous fleet management solution that gives carriers control over air updates, remote vehicle monitoring, remote vehicle assist, dispatching and access to real time data, such as weather and construction. The company was incorporated in 2016 and is headquartered in San Francisco, California.
| Metric | 2022 | 2021 | 2020 |
|---|---|---|---|
| Revenue | 0.00 | 0.00 | 0.00 |
| Cost of Revenue | 0.00 | 0.00 | 0.00 |
| Gross Profit | 0.00 | 0.00 | 0.00 |
| Gross Profit Ratio | 0.00% | 0.00% | 0.00% |
| Research & Development | 79.21M | 55.28M | 18.83M |
| General & Administrative | 74.45M | 48.39M | 3.60M |
| Selling & Marketing | 0.00 | 0.00 | 0.00 |
| SG&A | 74.45M | 48.39M | 3.60M |
| Other Expenses | -318.00K | -12.49M | 107.00K |
| Operating Expenses | 153.66M | 103.66M | 22.43M |
| Cost & Expenses | 153.66M | 103.66M | 22.43M |
| Interest Income | 2.22M | 98.00K | 788.00K |
| Interest Expense | 360.00K | 8.16M | 0.00 |
| Depreciation & Amortization | 6.98M | -11.31M | 1.72M |
| EBITDA | -146.69M | -114.98M | -20.71M |
| EBITDA Ratio | 0.00% | 0.00% | 0.00% |
| Operating Income | -153.66M | -103.66M | -22.43M |
| Operating Income Ratio | 0.00% | 0.00% | 0.00% |
| Total Other Income/Expenses | 50.50M | -20.55M | 895.00K |
| Income Before Tax | -103.16M | -124.21M | -21.53M |
| Income Before Tax Ratio | 0.00% | 0.00% | 0.00% |
| Income Tax Expense | -48.96M | -4.32M | 107.00K |
| Net Income | -54.21M | -119.89M | -21.64M |
| Net Income Ratio | 0.00% | 0.00% | 0.00% |
| EPS | -2.36 | -12.94 | -0.96 |
| EPS Diluted | -2.36 | -12.94 | -0.96 |
| Weighted Avg Shares Out | 23.00M | 9.27M | 22.48M |
| Weighted Avg Shares Out (Dil) | 23.00M | 9.27M | 22.48M |

Embark: Is Autonomous Trucking Going The Uncertain Way Of The Metaverse?

Embark Announces Date for Third Quarter 2022 Financial Results

7 Little-Known Stocks With Millionaire-Maker Potential

Gabelli Funds to Host 46th Annual Auto Symposium October 31st and November 1st

7 Small-Cap Stock Picks to Beat the September Market Slump

Why Is Embark Technology (EMBK) Stock Up 80% Today?

5 Penny Stocks To Buy For Under $5

Embark Technology, Inc. (EMBK) CEO Alex Rodrigues on Q2 2022 Results - Earnings Call Transcript

Embark Announces Date for Second Quarter 2022 Financial Results

Embark Tech Faces Uncertainties In Push For Autonomous Truck Operations
Source: https://incomestatements.info
Category: Stock Reports
