See more : Asset World Corp Public Company Limited (AWC.BK) Income Statement Analysis – Financial Results
Complete financial analysis of Erdene Resource Development Corporation (ERDCF) income statement, including revenue, profit margins, EPS and key performance metrics. Get detailed insights into the financial performance of Erdene Resource Development Corporation, a leading company in the Industrial Materials industry within the Basic Materials sector.
- Fusion Antibodies plc (FAB.L) Income Statement Analysis – Financial Results
- Interfactory, Inc. (4057.T) Income Statement Analysis – Financial Results
- Varonis Systems, Inc. (VRNS) Income Statement Analysis – Financial Results
- The Gap, Inc. (GPS) Income Statement Analysis – Financial Results
- Imerys S.A. (IMYSY) Income Statement Analysis – Financial Results
Erdene Resource Development Corporation (ERDCF)
About Erdene Resource Development Corporation
Erdene Resource Development Corporation focuses on the acquisition, exploration, and development of precious and base mineral deposits in Mongolia. It explores for copper, molybdenum, gold, silver, lead, and zinc deposits. The company principally holds a 100% interest in the Bayan Khundii Gold Project comprising 2,309 hectares located in the Bayankhongor province in Mongolia; and the Altan Nar Gold-Polymetallic project located in located in the Bayankhongor Aimag. It also holds interests in three mining licenses and two exploration licenses located in southwest Mongolia. The company was formerly known as Erdene Gold Inc. and changed its name to Erdene Resource Development Corporation in May 2008. Erdene Resource Development Corporation was incorporated in 2000 and is headquartered in Dartmouth, Canada.
| Metric | 2023 | 2022 | 2021 | 2020 | 2019 | 2018 | 2017 | 2016 | 2015 | 2014 | 2013 | 2012 | 2011 | 2010 | 2009 | 2008 | 2007 | 2006 | 2005 | 2004 | 2003 | 2002 | 2001 |
|---|---|---|---|---|---|---|---|---|---|---|---|---|---|---|---|---|---|---|---|---|---|---|---|
| Revenue | 0.00 | 0.00 | 0.00 | 0.00 | 0.00 | 0.00 | 0.00 | 0.00 | 0.00 | 0.00 | 0.00 | 0.00 | 882.83K | 526.59K | 167.96K | 0.00 | 267.30K | 250.18K | 0.00 | 197.58K | 8.54K | 169.00 | 1.38K |
| Cost of Revenue | 36.96K | 38.09K | 37.35K | 36.85K | 18.05K | 6.19K | 6.50K | 7.75K | 365.64K | 406.75K | 382.46K | 790.25K | 5.17M | 2.79M | 3.57M | 0.00 | 0.00 | 2.86M | 0.00 | 0.00 | 0.00 | 0.00 | 0.00 |
| Gross Profit | -36.96K | -38.09K | -37.35K | -36.85K | -18.05K | -6.19K | -6.50K | -7.75K | -365.64K | -406.75K | -382.46K | -790.25K | -4.28M | -2.26M | -3.40M | 0.00 | 267.30K | -2.61M | 0.00 | 197.58K | 8.54K | 169.00 | 1.38K |
| Gross Profit Ratio | 0.00% | 0.00% | 0.00% | 0.00% | 0.00% | 0.00% | 0.00% | 0.00% | 0.00% | 0.00% | 0.00% | 0.00% | -485.24% | -429.22% | -2,025.32% | 0.00% | 100.00% | -1,044.77% | 0.00% | 100.00% | 100.00% | 100.00% | 100.00% |
| Research & Development | 0.00 | 0.00 | 0.00 | 0.00 | 0.00 | 0.00 | 0.00 | 0.00 | 0.00 | 0.00 | 0.00 | 0.00 | 0.00 | 0.00 | 0.00 | 0.00 | 0.00 | 0.00 | 0.00 | 0.00 | 255.44K | 42.78K | 0.00 |
| General & Administrative | 3.14M | 2.18M | 1.94M | 1.83M | 1.60M | 2.11M | 2.44M | 1.44M | 379.81K | 322.33K | 556.99K | 1.65M | 9.84M | 2.59M | 1.94M | 2.25M | 0.00 | 0.00 | 0.00 | 0.00 | 0.00 | 0.00 | 0.00 |
| Selling & Marketing | 847.01K | 0.00 | 0.00 | 0.00 | 0.00 | 201.07K | 0.00 | 0.00 | 0.00 | 0.00 | 0.00 | 0.00 | 0.00 | 0.00 | 0.00 | 0.00 | 0.00 | 0.00 | 0.00 | 0.00 | 0.00 | 0.00 | 0.00 |
| SG&A | 3.98M | 2.18M | 1.94M | 1.83M | 1.60M | 2.11M | 2.44M | 1.44M | 379.81K | 322.33K | 556.99K | 1.65M | 9.84M | 2.59M | 1.94M | 2.25M | 2.38M | 2.33M | 1.36M | 1.09M | 382.19K | 48.59K | 0.00 |
| Other Expenses | -7.97M | 0.00 | 0.00 | 0.00 | 0.00 | 0.00 | 0.00 | 0.00 | 0.00 | 0.00 | 0.00 | 0.00 | 0.00 | -24.78K | 319.97K | 89.35K | 0.00 | 672.86K | 125.55K | -86.66K | 0.00 | 0.00 | 0.00 |
| Operating Expenses | -3.98M | 5.98M | 5.68M | 3.20M | 2.69M | 3.71M | 4.08M | 3.61M | 1.88M | 2.22M | 2.26M | 4.73M | 9.50M | 2.71M | 4.43M | 4.16M | 6.68M | 2.47M | 5.24M | 4.53M | 637.63K | 91.37K | 0.00 |
| Cost & Expenses | -3.98M | 6.02M | 5.72M | 3.24M | 2.71M | 3.72M | 4.08M | 3.62M | 2.25M | 2.63M | 2.64M | 4.73M | 14.67M | 5.49M | 4.43M | 4.16M | 6.68M | 5.33M | 5.24M | 4.53M | 637.63K | 91.37K | 0.00 |
| Interest Income | 269.61K | 58.38K | 55.02K | 62.86K | 36.51K | 50.82K | 91.51K | 11.96K | 4.93K | 2.94K | 8.79K | 96.38K | 82.57K | 89.94K | 223.36K | 483.14K | 412.48K | 303.46K | 155.86K | 184.10K | 0.00 | 0.00 | 0.00 |
| Interest Expense | 2.42K | 11.04K | 9.34K | 1.66M | 165.93K | 0.00 | 0.00 | 0.00 | 74.00 | 418.00 | 1.55K | 3.83K | 40.44K | 32.68K | 29.86K | 0.00 | 0.00 | 0.00 | 0.00 | 0.00 | 0.00 | 0.00 | 0.00 |
| Depreciation & Amortization | 36.96K | 136.59K | 82.51K | 54.39K | 32.27K | 20.93K | 18.29K | 14.95K | 16.65K | 20.31K | 29.09K | 37.56K | 358.54K | 408.41K | 317.13K | 86.64K | 71.68K | 148.52K | 35.79K | 13.94K | 1.55K | 0.00 | 0.00 |
| EBITDA | -3.95M | -5.88M | -5.58M | -3.19M | -2.68M | -3.70M | -4.06M | -3.60M | -2.22M | -2.61M | -2.60M | -4.60M | -13.34M | -4.49M | -2.80M | -4.08M | -6.34M | -4.93M | -5.17M | -4.53M | -630.27K | -91.20K | 1.38K |
| EBITDA Ratio | 0.00% | 0.00% | 0.00% | 0.00% | 0.00% | 0.00% | 0.00% | 0.00% | 0.00% | 0.00% | 0.00% | 0.00% | -1,511.45% | -853.50% | -2,123.64% | 0.00% | -2,372.57% | -1,787.73% | 0.00% | -2,184.71% | -7,346.53% | -53,965.09% | 100.00% |
| Operating Income | 3.98M | 6.02M | 5.72M | -3.24M | -2.71M | -3.72M | -4.12M | -3.62M | -2.24M | -2.62M | -2.63M | -4.73M | -13.78M | -4.97M | -3.88M | -4.16M | -6.41M | -5.54M | -5.26M | -4.34M | -629.09K | -91.20K | 1.38K |
| Operating Income Ratio | 0.00% | 0.00% | 0.00% | 0.00% | 0.00% | 0.00% | 0.00% | 0.00% | 0.00% | 0.00% | 0.00% | 0.00% | -1,561.41% | -943.43% | -2,312.46% | 0.00% | -2,399.38% | -2,214.98% | 0.00% | -2,198.33% | -7,364.68% | -53,965.09% | 100.00% |
| Total Other Income/Expenses | -3.46M | -12.00M | 149.12K | -9.87M | 23.22K | 59.08K | 54.32K | 1.12M | 4.85K | 2.52K | 7.24K | 92.56K | -4.68M | 235.25K | 2.30M | 572.50K | -1.05M | 212.68K | 98.82K | -93.14K | 2.73K | 0.00 | -1.38K |
| Income Before Tax | 522.04K | -5.99M | -5.57M | -13.12M | -2.68M | -3.66M | -4.03M | -2.50M | -2.24M | -2.62M | -2.62M | -4.64M | -13.74M | -4.51M | -3.15M | -3.59M | -7.46M | -5.33M | -5.16M | -4.44M | -629.09K | -91.20K | 0.00 |
| Income Before Tax Ratio | 0.00% | 0.00% | 0.00% | 0.00% | 0.00% | 0.00% | 0.00% | 0.00% | 0.00% | 0.00% | 0.00% | 0.00% | -1,556.64% | -856.39% | -1,873.32% | 0.00% | -2,791.98% | -2,129.97% | 0.00% | -2,245.47% | -7,364.68% | -53,965.09% | 0.00% |
| Income Tax Expense | 0.00 | 11.04K | 9.34K | 1.66M | 165.93K | -59.08K | -54.32K | -40.00 | 10.37M | 418.00 | 138.91K | 2.50M | 15.92K | -379.15K | -469.24K | -483.14K | -812.00K | 156.72K | -129.13K | 12.96K | 2.73K | -9.33K | 303.52K |
| Net Income | 522.04K | -5.99M | -5.57M | -13.12M | -2.68M | -3.66M | -4.03M | -2.50M | -12.61M | -2.62M | -2.76M | -7.05M | -11.86M | -3.57M | -2.18M | -3.59M | -6.65M | -4.57M | -4.98M | -4.44M | -629.09K | -76.14K | -303.52K |
| Net Income Ratio | 0.00% | 0.00% | 0.00% | 0.00% | 0.00% | 0.00% | 0.00% | 0.00% | 0.00% | 0.00% | 0.00% | 0.00% | -1,343.56% | -677.48% | -1,296.20% | 0.00% | -2,488.20% | -1,824.73% | 0.00% | -2,245.47% | -7,364.68% | -45,053.85% | -21,993.84% |
| EPS | 0.00 | -0.02 | -0.02 | -0.06 | -0.02 | -0.02 | -0.03 | -0.02 | -0.14 | -0.04 | -0.05 | -0.15 | -0.26 | -0.08 | -0.05 | -0.09 | -0.21 | -0.22 | -0.37 | -0.38 | -0.29 | -0.10 | -0.22 |
| EPS Diluted | 0.00 | -0.02 | -0.02 | -0.06 | -0.02 | -0.02 | -0.03 | -0.02 | -0.14 | -0.04 | -0.05 | -0.15 | -0.26 | -0.08 | -0.05 | -0.09 | -0.21 | -0.22 | -0.37 | -0.38 | -0.29 | -0.10 | -0.22 |
| Weighted Avg Shares Out | 346.18M | 306.20M | 276.14M | 216.54M | 178.52M | 155.10M | 142.92M | 117.13M | 92.59M | 74.26M | 58.70M | 48.09M | 45.36M | 44.63M | 44.62M | 40.22M | 31.19M | 21.19M | 13.45M | 11.56M | 2.20M | 759.56K | 1.38M |
| Weighted Avg Shares Out (Dil) | 345.97M | 306.20M | 276.14M | 216.54M | 178.52M | 155.10M | 142.92M | 117.13M | 92.59M | 74.26M | 58.70M | 48.09M | 45.36M | 44.63M | 44.62M | 40.22M | 31.19M | 21.19M | 13.45M | 11.56M | 2.20M | 759.56K | 1.38M |

Erdene confirms high-grade gold in Bayan Khundii drilling, prepares for 2025 mining start
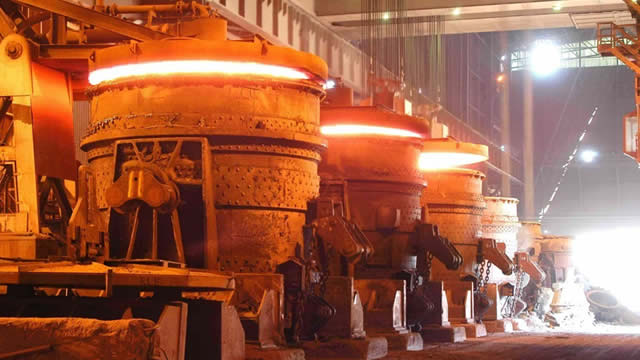
Erdene advances Bayan Khundii gold project in second quarter

Erdene Resource CEO shares major milestones ahead of 2025 gold production
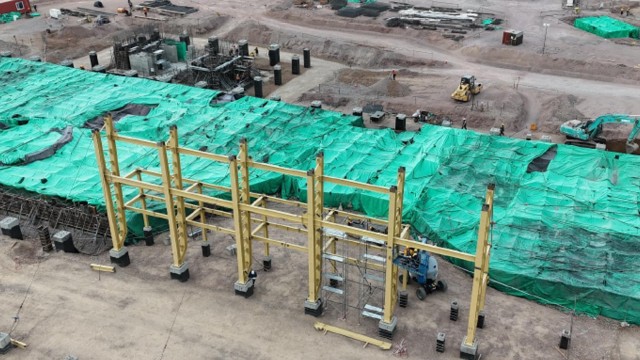
Erdene Resources advances Bayan Khundii gold project, kicks off exploration program during Q1
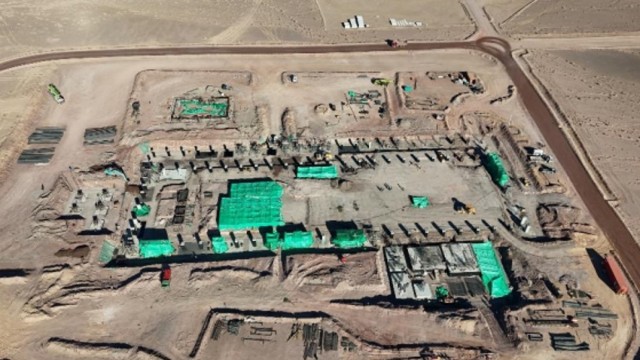
Erdene reflects on transformative year as construction ramps up at Bayan Khundii gold project
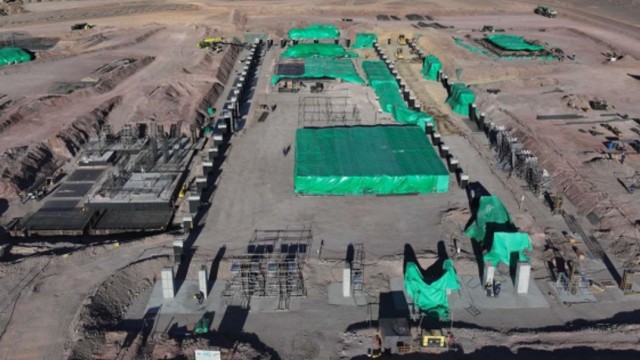
Erdene Resource Development secures $80M financing for Bayan Khundii gold project
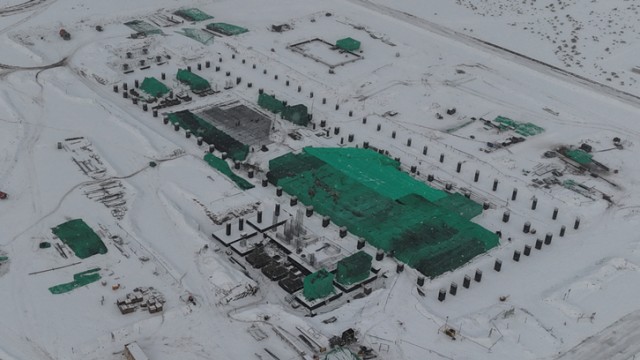
Erdene Resource Development on track to kickoff production at Bayan Khundii gold mine in 2Q 2025
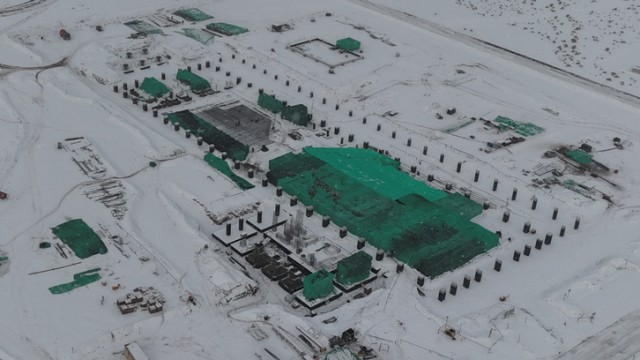
Erdene Resource Development begins construction at Bayan Khundii gold project in Mongolia
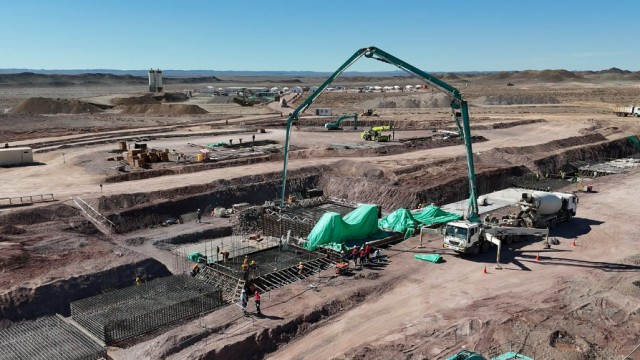
Erdene Resource Development advances Bayan Khundii gold project in 3Q

Erdene updates investors on amendments to strategic alliance for Bayan Khundii gold project
Source: https://incomestatements.info
Category: Stock Reports
