See more : Cytokinetics, Incorporated (CYTK) Income Statement Analysis – Financial Results
Complete financial analysis of Neometals Ltd (RRSSF) income statement, including revenue, profit margins, EPS and key performance metrics. Get detailed insights into the financial performance of Neometals Ltd, a leading company in the Industrial Materials industry within the Basic Materials sector.
- Invincible Investment Corporation (8963.T) Income Statement Analysis – Financial Results
- Daiken Corporation (7905.T) Income Statement Analysis – Financial Results
- Shoprite Holdings Limited (SRHGF) Income Statement Analysis – Financial Results
- Intensity Therapeutics, Inc. (INTS) Income Statement Analysis – Financial Results
- Labrador Iron Ore Royalty Corporation (LIFZF) Income Statement Analysis – Financial Results
Neometals Ltd (RRSSF)
About Neometals Ltd
Neometals Ltd explores for mineral projects in Australia. The company operates through three segments: Lithium, Titanium/Vanadium, and Other. Its projects include the Lithium-ion Battery Recycling project, which recovers cobalt and other materials from spent and scrap lithium batteries; Vanadium Recovery project, which recovers vanadium pentoxide through processing of steelmaking by-products; Lithium Refinery project; and Barrambie Titanium and Vanadium project located in Western Australia. The company was formerly known as Reed Resources Ltd. and changed its name to Neometals Ltd in December 2014. Neometals Ltd was incorporated in 2001 and is based in West Perth, Australia.
| Metric | 2023 | 2022 | 2021 | 2020 | 2019 | 2018 | 2017 | 2016 | 2015 | 2014 | 2013 | 2012 | 2011 | 2010 | 2009 | 2008 | 2007 | 2006 | 2005 | 2004 | 2003 | 2002 | 2001 |
|---|---|---|---|---|---|---|---|---|---|---|---|---|---|---|---|---|---|---|---|---|---|---|---|
| Revenue | 0.00 | 0.00 | 0.00 | 0.00 | 0.00 | 0.00 | 0.00 | 0.00 | 419.53K | 7.80M | 32.55M | 0.00 | 347.82K | 2.91M | 3.64M | 1.97M | 402.86K | 264.22K | 0.00 | 0.00 | 0.00 | 0.00 | 0.00 |
| Cost of Revenue | 523.02K | 457.13K | 598.61K | 754.97K | 117.36K | 0.00 | 0.00 | 0.00 | 159.87K | 9.93M | 39.48M | 0.00 | 53.63K | 853.68K | 2.40M | 1.40M | 310.95K | 51.87K | 0.00 | 0.00 | 0.00 | 0.00 | 0.00 |
| Gross Profit | -523.02K | -457.13K | -598.61K | -754.97K | -117.36K | 0.00 | 0.00 | 0.00 | 259.65K | -2.13M | -6.93M | 0.00 | 294.19K | 2.06M | 1.24M | 571.08K | 91.91K | 212.35K | 0.00 | 0.00 | 0.00 | 0.00 | 0.00 |
| Gross Profit Ratio | 0.00% | 0.00% | 0.00% | 0.00% | 0.00% | 0.00% | 0.00% | 0.00% | 61.89% | -27.33% | -21.30% | 0.00% | 84.58% | 70.70% | 34.09% | 28.95% | 22.81% | 80.37% | 0.00% | 0.00% | 0.00% | 0.00% | 0.00% |
| Research & Development | 303.72K | 1.45M | 3.13M | 3.57M | 3.93K | 0.00 | 0.00 | 0.00 | 0.00 | 0.00 | 0.00 | 0.00 | 0.00 | 0.00 | 0.00 | 0.00 | 0.00 | 0.00 | 0.00 | 0.00 | 0.00 | 0.00 | 0.00 |
| General & Administrative | 11.34M | 8.99M | 7.26M | 10.59M | 11.06M | 7.76M | 6.87M | 4.95M | 2.93M | 3.13M | 8.60M | 6.77M | 5.60M | 4.48M | 3.96M | 3.28M | 2.04M | 1.53M | 583.23K | 364.69K | 323.06K | 99.53K | 0.00 |
| Selling & Marketing | 450.91K | 518.08K | 526.46K | 304.08K | 405.22K | 0.00 | 0.00 | 0.00 | 0.00 | 0.00 | 0.00 | 0.00 | 0.00 | 0.00 | 0.00 | 0.00 | 0.00 | 0.00 | 53.07K | 49.52K | 42.41K | 19.00K | 0.00 |
| SG&A | 21.53M | 9.51M | 7.79M | 10.89M | 11.46M | 7.76M | 6.87M | 4.95M | 2.93M | 3.13M | 8.60M | 6.77M | 5.60M | 4.48M | 3.96M | 3.28M | 2.04M | 1.53M | 636.30K | 414.22K | 365.46K | 118.53K | 0.00 |
| Other Expenses | -809.02K | 891.94K | 35.64M | 316.28K | 511.81K | 544.07K | 10.12M | 88.59M | 463.06K | -6.71M | 24.52M | -456.12K | -164.02K | 126.21K | 102.51K | 61.20K | 63.36K | 81.75K | 1.00K | -147.61K | -116.77K | -30.62K | 0.00 |
| Operating Expenses | 21.84M | 23.19M | 16.71M | 17.12M | 15.26M | -4.55M | 7.67M | 5.17M | 10.76M | 5.36M | 80.28M | 27.37M | 6.09M | 6.02M | 5.71M | 5.40M | 2.17M | 1.77M | 1.07M | 670.18K | 599.99K | 208.13K | 0.00 |
| Cost & Expenses | 22.36M | 23.19M | 16.71M | 17.12M | 15.26M | -4.55M | 7.67M | 5.17M | 10.92M | 15.29M | 119.76M | 27.37M | 6.15M | 6.87M | 8.11M | 6.80M | 2.48M | 1.83M | 1.07M | 670.18K | 599.99K | 208.13K | 0.00 |
| Interest Income | 1.06M | 254.05K | 527.40K | 1.63M | 1.14M | 926.38K | 1.42M | 671.24K | 296.37K | 268.79K | 696.82K | 790.81K | 893.83K | 496.98K | 885.07K | 482.97K | 91.58K | 64.76K | 104.44K | 53.09K | 163.22K | 919.00 | 0.00 |
| Interest Expense | 29.86K | 76.16K | 63.31K | 63.19K | 60.65K | 62.60K | 97.87K | 266.83K | 488.40K | 739.62K | 4.47M | 1.09M | 17.43K | 148.60K | 149.76K | 155.76K | 30.22K | 0.00 | 5.12K | 2.28K | 3.56K | 2.73K | 0.00 |
| Depreciation & Amortization | 523.02K | 457.13K | 598.61K | 754.97K | 117.36K | 42.53K | 33.82K | 41.74K | 43.75K | 113.73K | 1.56M | 223.54K | 488.45K | 696.04K | 1.40M | 61.20K | 63.36K | 81.75K | 53.50K | 52.13K | 34.16K | 4.06K | 0.00 |
| EBITDA | -21.84M | -22.78M | 19.96M | -14.42M | -11.35M | -7.72M | -6.83M | -4.91M | -8.62M | -6.49M | -2.06M | -6.58M | -4.32M | -2.32M | -2.08M | -4.22M | -1.86M | -1.36M | -1.04M | -712.57K | -519.39K | -233.77K | 0.00 |
| EBITDA Ratio | 0.00% | 0.00% | 0.00% | 0.00% | 0.00% | 0.00% | 0.00% | 0.00% | -2,395.14% | -175.68% | -180.86% | 0.00% | -1,242.80% | -90.59% | -57.06% | -214.03% | -460.67% | -516.01% | 0.00% | 0.00% | 0.00% | 0.00% | 0.00% |
| Operating Income | -22.36M | -23.24M | 19.36M | -15.18M | -13.96M | 21.38M | 4.44M | 84.10M | -10.09M | -13.82M | -60.43M | -26.81M | -4.81M | -3.34M | -3.48M | -4.28M | -1.92M | -1.45M | -968.04K | -764.70K | -553.55K | -237.83K | 0.00 |
| Operating Income Ratio | 0.00% | 0.00% | 0.00% | 0.00% | 0.00% | 0.00% | 0.00% | 0.00% | -2,405.57% | -177.14% | -185.65% | 0.00% | -1,383.23% | -114.48% | -95.57% | -217.14% | -476.39% | -546.94% | 0.00% | 0.00% | 0.00% | 0.00% | 0.00% |
| Total Other Income/Expenses | -13.82M | 3.97M | 37.55M | -2.68M | -5.29M | -269.71K | 11.98M | 88.96M | -90.16K | -756.36K | -4.50M | -21.41M | 790.28K | -148.60K | -149.76K | -155.76K | -1.09M | 71.63K | 118.47K | -2.28K | -3.56K | -2.73K | 0.00 |
| Income Before Tax | -25.47M | -16.23M | 20.98M | -19.84M | -19.24M | 19.64M | 4.34M | 83.83M | -10.58M | -14.57M | -64.93M | -28.22M | -4.74M | -3.48M | -3.63M | -4.44M | -3.01M | -1.53M | -973.16K | -766.98K | -557.10K | -240.56K | 0.00 |
| Income Before Tax Ratio | 0.00% | 0.00% | 0.00% | 0.00% | 0.00% | 0.00% | 0.00% | 0.00% | -2,521.99% | -186.83% | -199.48% | 0.00% | -1,362.37% | -119.58% | -99.69% | -225.03% | -745.93% | -579.10% | 0.00% | 0.00% | 0.00% | 0.00% | 0.00% |
| Income Tax Expense | -1.37M | -5.07M | 4.55M | -5.28M | 3.26M | -568.61K | -403.85K | -773.90K | -265.99K | -3.88M | 7.33M | 3.40M | -1.39M | -817.67K | -1.16M | -1.26M | -582.00K | -543.95K | -973.16K | -766.98K | -557.10K | -240.56K | 0.00 |
| Net Income | -34.80M | 4.36M | 16.34M | -14.55M | 76.18M | 20.21M | 4.75M | 84.61M | -10.31M | -16.67M | -75.58M | -30.98M | -3.35M | -2.67M | -2.47M | -3.18M | -2.42M | -986.18K | -973.16K | -766.98K | -557.10K | -240.56K | 0.00 |
| Net Income Ratio | 0.00% | 0.00% | 0.00% | 0.00% | 0.00% | 0.00% | 0.00% | 0.00% | -2,458.59% | -213.66% | -232.19% | 0.00% | -964.17% | -91.52% | -67.80% | -161.16% | -601.47% | -373.24% | 0.00% | 0.00% | 0.00% | 0.00% | 0.00% |
| EPS | -0.06 | -0.02 | 0.03 | -0.03 | 0.14 | 0.04 | 0.01 | 0.16 | -0.02 | -0.03 | -0.15 | -0.11 | -0.01 | -0.02 | -0.02 | -0.03 | -0.03 | -0.01 | -0.01 | -0.01 | -0.01 | -0.07 | 0.00 |
| EPS Diluted | -0.06 | -0.02 | 0.03 | -0.03 | 0.14 | 0.04 | 0.01 | 0.16 | -0.02 | -0.03 | -0.15 | -0.11 | -0.01 | -0.02 | -0.02 | -0.03 | -0.03 | -0.01 | -0.01 | -0.01 | -0.01 | -0.07 | 0.00 |
| Weighted Avg Shares Out | 567.30M | 563.31M | 560.29M | 559.44M | 558.88M | 541.46M | 560.88M | 539.64M | 502.21M | 523.15M | 501.16M | 292.14M | 236.57M | 175.38M | 145.37M | 118.89M | 87.45M | 78.28M | 68.39M | 55.31M | 50.96M | 3.52M | 51.90M |
| Weighted Avg Shares Out (Dil) | 567.30M | 565.45M | 560.29M | 559.44M | 558.88M | 541.46M | 564.97M | 541.65M | 502.21M | 568.82M | 501.16M | 292.14M | 236.57M | 175.38M | 145.37M | 118.89M | 87.45M | 78.28M | 68.39M | 55.31M | 50.96M | 3.52M | 51.90M |

Neometals preparing to launch fundraiser
Neometals regroups around Primobius joint venture
Neometals gets US$3m cash injection from major shareholder
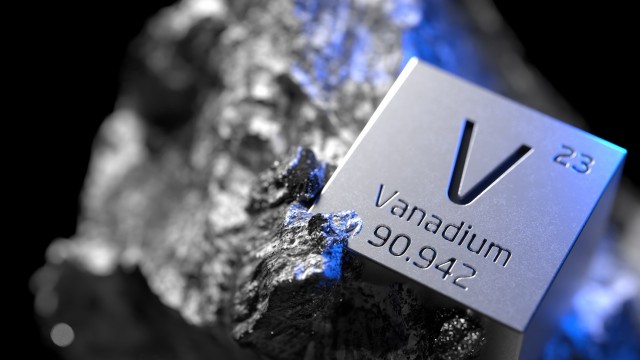
Vanadium Miners News For The Month Of March 2024
Vanadium Miners News For The Month Of February 2024
Neometals battery recycling tech potentially still very valuable - analyst

Neometals gets cash boost as it closes oversubscribed placing
Neometals' stock could get another boost from latest lithium chemical trial
Vanadium Miners News For The Month Of October 2023
Neometals may be undervalued but analysts question mining ops
Source: https://incomestatements.info
Category: Stock Reports
