See more : Easy Field Corporation (6425.TWO) Income Statement Analysis – Financial Results
Complete financial analysis of Neometals Ltd (RRSSF) income statement, including revenue, profit margins, EPS and key performance metrics. Get detailed insights into the financial performance of Neometals Ltd, a leading company in the Industrial Materials industry within the Basic Materials sector.
- GreenVision Acquisition Corp. (GRNVU) Income Statement Analysis – Financial Results
- EG Acquisition Corp. (EGGF-UN) Income Statement Analysis – Financial Results
- Atlas Crest Investment Corp. II (ACIIW) Income Statement Analysis – Financial Results
- Bank of America Corporation (BAC-PB) Income Statement Analysis – Financial Results
- Relicab Cable Manufacturing Limited (RELICAB.BO) Income Statement Analysis – Financial Results
Neometals Ltd (RRSSF)
About Neometals Ltd
Neometals Ltd explores for mineral projects in Australia. The company operates through three segments: Lithium, Titanium/Vanadium, and Other. Its projects include the Lithium-ion Battery Recycling project, which recovers cobalt and other materials from spent and scrap lithium batteries; Vanadium Recovery project, which recovers vanadium pentoxide through processing of steelmaking by-products; Lithium Refinery project; and Barrambie Titanium and Vanadium project located in Western Australia. The company was formerly known as Reed Resources Ltd. and changed its name to Neometals Ltd in December 2014. Neometals Ltd was incorporated in 2001 and is based in West Perth, Australia.
| Metric | 2023 | 2022 | 2021 | 2020 | 2019 | 2018 | 2017 | 2016 | 2015 | 2014 | 2013 | 2012 | 2011 | 2010 | 2009 | 2008 | 2007 | 2006 | 2005 | 2004 | 2003 | 2002 | 2001 |
|---|---|---|---|---|---|---|---|---|---|---|---|---|---|---|---|---|---|---|---|---|---|---|---|
| Revenue | 0.00 | 0.00 | 0.00 | 0.00 | 0.00 | 0.00 | 0.00 | 0.00 | 419.53K | 7.80M | 32.55M | 0.00 | 347.82K | 2.91M | 3.64M | 1.97M | 402.86K | 264.22K | 0.00 | 0.00 | 0.00 | 0.00 | 0.00 |
| Cost of Revenue | 523.02K | 457.13K | 598.61K | 754.97K | 117.36K | 0.00 | 0.00 | 0.00 | 159.87K | 9.93M | 39.48M | 0.00 | 53.63K | 853.68K | 2.40M | 1.40M | 310.95K | 51.87K | 0.00 | 0.00 | 0.00 | 0.00 | 0.00 |
| Gross Profit | -523.02K | -457.13K | -598.61K | -754.97K | -117.36K | 0.00 | 0.00 | 0.00 | 259.65K | -2.13M | -6.93M | 0.00 | 294.19K | 2.06M | 1.24M | 571.08K | 91.91K | 212.35K | 0.00 | 0.00 | 0.00 | 0.00 | 0.00 |
| Gross Profit Ratio | 0.00% | 0.00% | 0.00% | 0.00% | 0.00% | 0.00% | 0.00% | 0.00% | 61.89% | -27.33% | -21.30% | 0.00% | 84.58% | 70.70% | 34.09% | 28.95% | 22.81% | 80.37% | 0.00% | 0.00% | 0.00% | 0.00% | 0.00% |
| Research & Development | 303.72K | 1.45M | 3.13M | 3.57M | 3.93K | 0.00 | 0.00 | 0.00 | 0.00 | 0.00 | 0.00 | 0.00 | 0.00 | 0.00 | 0.00 | 0.00 | 0.00 | 0.00 | 0.00 | 0.00 | 0.00 | 0.00 | 0.00 |
| General & Administrative | 11.34M | 8.99M | 7.26M | 10.59M | 11.06M | 7.76M | 6.87M | 4.95M | 2.93M | 3.13M | 8.60M | 6.77M | 5.60M | 4.48M | 3.96M | 3.28M | 2.04M | 1.53M | 583.23K | 364.69K | 323.06K | 99.53K | 0.00 |
| Selling & Marketing | 450.91K | 518.08K | 526.46K | 304.08K | 405.22K | 0.00 | 0.00 | 0.00 | 0.00 | 0.00 | 0.00 | 0.00 | 0.00 | 0.00 | 0.00 | 0.00 | 0.00 | 0.00 | 53.07K | 49.52K | 42.41K | 19.00K | 0.00 |
| SG&A | 21.53M | 9.51M | 7.79M | 10.89M | 11.46M | 7.76M | 6.87M | 4.95M | 2.93M | 3.13M | 8.60M | 6.77M | 5.60M | 4.48M | 3.96M | 3.28M | 2.04M | 1.53M | 636.30K | 414.22K | 365.46K | 118.53K | 0.00 |
| Other Expenses | -809.02K | 891.94K | 35.64M | 316.28K | 511.81K | 544.07K | 10.12M | 88.59M | 463.06K | -6.71M | 24.52M | -456.12K | -164.02K | 126.21K | 102.51K | 61.20K | 63.36K | 81.75K | 1.00K | -147.61K | -116.77K | -30.62K | 0.00 |
| Operating Expenses | 21.84M | 23.19M | 16.71M | 17.12M | 15.26M | -4.55M | 7.67M | 5.17M | 10.76M | 5.36M | 80.28M | 27.37M | 6.09M | 6.02M | 5.71M | 5.40M | 2.17M | 1.77M | 1.07M | 670.18K | 599.99K | 208.13K | 0.00 |
| Cost & Expenses | 22.36M | 23.19M | 16.71M | 17.12M | 15.26M | -4.55M | 7.67M | 5.17M | 10.92M | 15.29M | 119.76M | 27.37M | 6.15M | 6.87M | 8.11M | 6.80M | 2.48M | 1.83M | 1.07M | 670.18K | 599.99K | 208.13K | 0.00 |
| Interest Income | 1.06M | 254.05K | 527.40K | 1.63M | 1.14M | 926.38K | 1.42M | 671.24K | 296.37K | 268.79K | 696.82K | 790.81K | 893.83K | 496.98K | 885.07K | 482.97K | 91.58K | 64.76K | 104.44K | 53.09K | 163.22K | 919.00 | 0.00 |
| Interest Expense | 29.86K | 76.16K | 63.31K | 63.19K | 60.65K | 62.60K | 97.87K | 266.83K | 488.40K | 739.62K | 4.47M | 1.09M | 17.43K | 148.60K | 149.76K | 155.76K | 30.22K | 0.00 | 5.12K | 2.28K | 3.56K | 2.73K | 0.00 |
| Depreciation & Amortization | 523.02K | 457.13K | 598.61K | 754.97K | 117.36K | 42.53K | 33.82K | 41.74K | 43.75K | 113.73K | 1.56M | 223.54K | 488.45K | 696.04K | 1.40M | 61.20K | 63.36K | 81.75K | 53.50K | 52.13K | 34.16K | 4.06K | 0.00 |
| EBITDA | -21.84M | -22.78M | 19.96M | -14.42M | -11.35M | -7.72M | -6.83M | -4.91M | -8.62M | -6.49M | -2.06M | -6.58M | -4.32M | -2.32M | -2.08M | -4.22M | -1.86M | -1.36M | -1.04M | -712.57K | -519.39K | -233.77K | 0.00 |
| EBITDA Ratio | 0.00% | 0.00% | 0.00% | 0.00% | 0.00% | 0.00% | 0.00% | 0.00% | -2,395.14% | -175.68% | -180.86% | 0.00% | -1,242.80% | -90.59% | -57.06% | -214.03% | -460.67% | -516.01% | 0.00% | 0.00% | 0.00% | 0.00% | 0.00% |
| Operating Income | -22.36M | -23.24M | 19.36M | -15.18M | -13.96M | 21.38M | 4.44M | 84.10M | -10.09M | -13.82M | -60.43M | -26.81M | -4.81M | -3.34M | -3.48M | -4.28M | -1.92M | -1.45M | -968.04K | -764.70K | -553.55K | -237.83K | 0.00 |
| Operating Income Ratio | 0.00% | 0.00% | 0.00% | 0.00% | 0.00% | 0.00% | 0.00% | 0.00% | -2,405.57% | -177.14% | -185.65% | 0.00% | -1,383.23% | -114.48% | -95.57% | -217.14% | -476.39% | -546.94% | 0.00% | 0.00% | 0.00% | 0.00% | 0.00% |
| Total Other Income/Expenses | -13.82M | 3.97M | 37.55M | -2.68M | -5.29M | -269.71K | 11.98M | 88.96M | -90.16K | -756.36K | -4.50M | -21.41M | 790.28K | -148.60K | -149.76K | -155.76K | -1.09M | 71.63K | 118.47K | -2.28K | -3.56K | -2.73K | 0.00 |
| Income Before Tax | -25.47M | -16.23M | 20.98M | -19.84M | -19.24M | 19.64M | 4.34M | 83.83M | -10.58M | -14.57M | -64.93M | -28.22M | -4.74M | -3.48M | -3.63M | -4.44M | -3.01M | -1.53M | -973.16K | -766.98K | -557.10K | -240.56K | 0.00 |
| Income Before Tax Ratio | 0.00% | 0.00% | 0.00% | 0.00% | 0.00% | 0.00% | 0.00% | 0.00% | -2,521.99% | -186.83% | -199.48% | 0.00% | -1,362.37% | -119.58% | -99.69% | -225.03% | -745.93% | -579.10% | 0.00% | 0.00% | 0.00% | 0.00% | 0.00% |
| Income Tax Expense | -1.37M | -5.07M | 4.55M | -5.28M | 3.26M | -568.61K | -403.85K | -773.90K | -265.99K | -3.88M | 7.33M | 3.40M | -1.39M | -817.67K | -1.16M | -1.26M | -582.00K | -543.95K | -973.16K | -766.98K | -557.10K | -240.56K | 0.00 |
| Net Income | -34.80M | 4.36M | 16.34M | -14.55M | 76.18M | 20.21M | 4.75M | 84.61M | -10.31M | -16.67M | -75.58M | -30.98M | -3.35M | -2.67M | -2.47M | -3.18M | -2.42M | -986.18K | -973.16K | -766.98K | -557.10K | -240.56K | 0.00 |
| Net Income Ratio | 0.00% | 0.00% | 0.00% | 0.00% | 0.00% | 0.00% | 0.00% | 0.00% | -2,458.59% | -213.66% | -232.19% | 0.00% | -964.17% | -91.52% | -67.80% | -161.16% | -601.47% | -373.24% | 0.00% | 0.00% | 0.00% | 0.00% | 0.00% |
| EPS | -0.06 | -0.02 | 0.03 | -0.03 | 0.14 | 0.04 | 0.01 | 0.16 | -0.02 | -0.03 | -0.15 | -0.11 | -0.01 | -0.02 | -0.02 | -0.03 | -0.03 | -0.01 | -0.01 | -0.01 | -0.01 | -0.07 | 0.00 |
| EPS Diluted | -0.06 | -0.02 | 0.03 | -0.03 | 0.14 | 0.04 | 0.01 | 0.16 | -0.02 | -0.03 | -0.15 | -0.11 | -0.01 | -0.02 | -0.02 | -0.03 | -0.03 | -0.01 | -0.01 | -0.01 | -0.01 | -0.07 | 0.00 |
| Weighted Avg Shares Out | 567.30M | 563.31M | 560.29M | 559.44M | 558.88M | 541.46M | 560.88M | 539.64M | 502.21M | 523.15M | 501.16M | 292.14M | 236.57M | 175.38M | 145.37M | 118.89M | 87.45M | 78.28M | 68.39M | 55.31M | 50.96M | 3.52M | 51.90M |
| Weighted Avg Shares Out (Dil) | 567.30M | 565.45M | 560.29M | 559.44M | 558.88M | 541.46M | 564.97M | 541.65M | 502.21M | 568.82M | 501.16M | 292.14M | 236.57M | 175.38M | 145.37M | 118.89M | 87.45M | 78.28M | 68.39M | 55.31M | 50.96M | 3.52M | 51.90M |
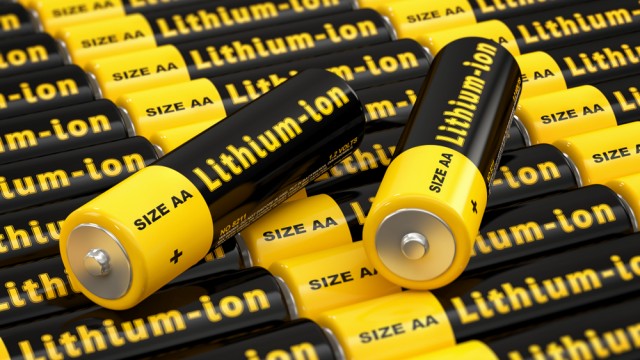
Neometals welcomes seasoned expert to lead lithium-ion battery recycling projects
Neometals shares surge 9% after a boost to lithium yields

Neometals spikes after battery recycling technology wins first patent in Australia
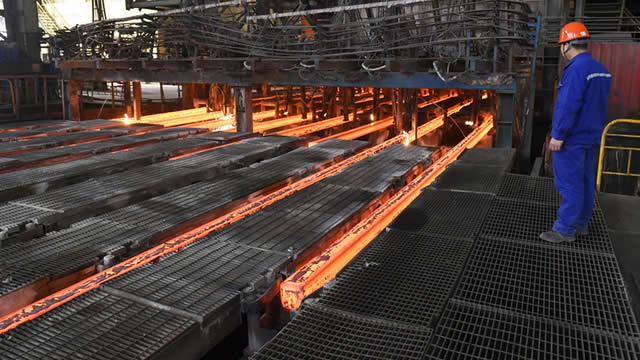
Primobius receives battery recycling plant purchase order from Mercedes - Neometals
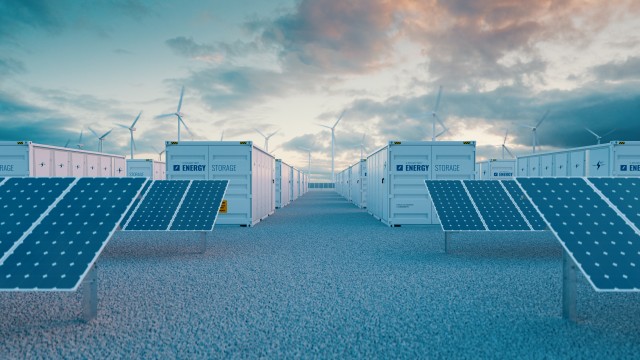
Vanadium Miners News For The Month Of July 2023
Neometals signs vanadium offtake with Glencore

Vanadium Miners News For The Month Of June 2023
Don't fear substitution - Neometals' Chris Reed says lithium-ion chemistries will dominate
Vanadium Miners News For The Month Of May 2023
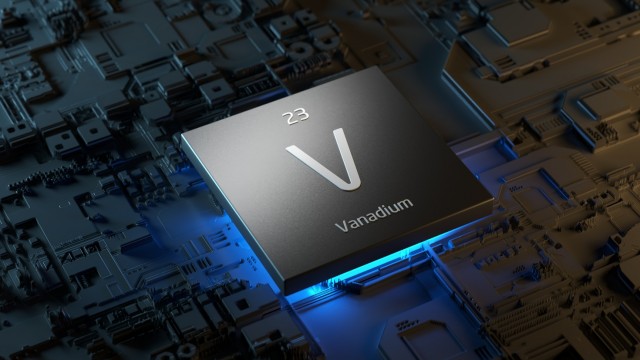
Vanadium Miners News For The Month Of March 2023
Source: https://incomestatements.info
Category: Stock Reports
