See more : Ichikura Co., Ltd. (6186.T) Income Statement Analysis – Financial Results
Complete financial analysis of Shimao Group Holdings Limited (SIOPF) income statement, including revenue, profit margins, EPS and key performance metrics. Get detailed insights into the financial performance of Shimao Group Holdings Limited, a leading company in the Real Estate – Development industry within the Real Estate sector.
- Kornit Digital Ltd. (KRNT) Income Statement Analysis – Financial Results
- Capital Power Corp (CPRHF) Income Statement Analysis – Financial Results
- PACCAR Inc (PAE.DE) Income Statement Analysis – Financial Results
- Capgemini SE (CAPMF) Income Statement Analysis – Financial Results
- Legendary Group Limited (8195.HK) Income Statement Analysis – Financial Results
Shimao Group Holdings Limited (SIOPF)
About Shimao Group Holdings Limited
Shimao Group Holdings Limited, an investment holding company, engages in the property development and investment activities in the People's Republic of China. The company develops residential and commercial properties; and operates hotels and shopping malls. It is also involved in the trading of construction materials; and property management activities. The company was formerly known as Shimao Property Holdings Limited and changed its name to Shimao Group Holdings Limited in May 2020. Shimao Group Holdings Limited was incorporated in 2004 and is based in Hong Kong, Hong Kong. Shimao Group Holdings Limited operates as a subsidiary of Gemfair Investments Limited.
| Metric | 2023 | 2022 | 2021 | 2020 | 2019 | 2018 | 2017 | 2016 | 2015 | 2014 | 2013 | 2012 | 2011 | 2010 | 2009 | 2008 | 2007 | 2006 |
|---|---|---|---|---|---|---|---|---|---|---|---|---|---|---|---|---|---|---|
| Revenue | 59.46B | 63.04B | 107.80B | 135.35B | 111.52B | 85.51B | 70.43B | 59.29B | 57.73B | 56.08B | 41.50B | 28.65B | 26.03B | 21.79B | 17.03B | 7.20B | 9.28B | 6.91B |
| Cost of Revenue | 53.62B | 57.76B | 104.51B | 94.98B | 76.79B | 58.07B | 48.57B | 41.24B | 37.99B | 34.63B | 24.42B | 19.05B | 16.03B | 13.81B | 11.15B | 3.96B | 5.32B | 4.08B |
| Gross Profit | 5.85B | 5.28B | 3.29B | 40.38B | 34.73B | 27.45B | 21.86B | 18.05B | 19.74B | 21.46B | 17.08B | 9.61B | 10.00B | 7.98B | 5.88B | 3.23B | 3.96B | 2.84B |
| Gross Profit Ratio | 9.83% | 8.38% | 3.05% | 29.83% | 31.14% | 32.10% | 31.04% | 30.44% | 34.20% | 38.26% | 41.16% | 33.53% | 38.42% | 36.61% | 34.54% | 44.91% | 42.69% | 41.02% |
| Research & Development | 0.00 | 0.00 | 0.00 | 0.00 | 0.00 | 0.00 | 0.00 | 0.00 | 0.00 | 0.00 | 0.00 | 0.00 | 0.00 | 0.00 | 0.00 | 0.00 | 0.00 | 0.00 |
| General & Administrative | 4.70B | 5.72B | 6.00B | 5.50B | 4.38B | 3.43B | 2.99B | 2.74B | 3.28B | 2.81B | 2.28B | 1.82B | 1.35B | 1.08B | 1.11B | 1.07B | 949.82M | 667.58M |
| Selling & Marketing | 1.42B | 2.81B | 5.38B | 4.42B | 2.82B | 2.02B | 1.46B | 1.35B | 1.62B | 1.50B | 1.31B | 1.05B | 769.89M | 563.90M | 470.43M | 281.76M | 0.00 | 0.00 |
| SG&A | 6.12B | 8.53B | 11.38B | 9.92B | 7.21B | 5.45B | 4.45B | 4.10B | 4.89B | 4.30B | 3.59B | 2.86B | 2.12B | 1.65B | 1.58B | 1.35B | 949.82M | 667.58M |
| Other Expenses | 12.97B | 3.56B | 277.11M | 91.39M | 16.00M | 34.11M | 42.04M | 40.18M | 57.93M | 81.71M | 0.00 | 30.24M | -3.13B | -2.96B | -1.69B | -367.07M | -54.19M | 240.05M |
| Operating Expenses | 19.10B | 16.64B | 19.81B | 5.70B | 6.67B | 1.30B | 3.02B | 4.54B | 5.80B | 5.96B | 3.90B | 2.79B | -1.01B | -1.31B | -115.86M | 980.53M | -1.70B | -263.02M |
| Cost & Expenses | 72.71B | 74.39B | 124.32B | 100.68B | 83.45B | 59.37B | 51.58B | 45.78B | 43.79B | 40.58B | 28.32B | 21.83B | 15.02B | 12.50B | 11.03B | 4.94B | 3.61B | 3.81B |
| Interest Income | 284.16M | 6.20B | 5.05B | 1.08B | 952.77M | 6.11B | 150.06M | 312.24M | 219.62M | 240.52M | 121.36M | 146.06M | 100.07M | 66.25M | 30.47M | 28.01M | 102.54M | 0.00 |
| Interest Expense | 6.42B | 6.59B | 5.94B | 2.31B | 0.00 | -1.06B | 731.57M | 110.55M | -220.85M | 412.09M | 312.21M | 168.17M | 480.42M | 737.80M | 337.65M | 377.64M | 54.19M | 0.00 |
| Depreciation & Amortization | 1.09B | 1.26B | 1.03B | 984.67M | 954.69M | 663.88M | 665.34M | 514.33M | 430.07M | 475.49M | 372.58M | 389.40M | 338.07M | 304.69M | 271.28M | 259.61M | 0.00 | 0.00 |
| EBITDA | -14.73B | -3.66B | -14.61B | 29.89B | 29.94B | 22.25B | 17.33B | 13.82B | 14.01B | 16.26B | 11.50B | 9.93B | 11.57B | 9.61B | 6.32B | 2.42B | 5.66B | 3.10B |
| EBITDA Ratio | -24.78% | -5.80% | -13.13% | 22.08% | 24.65% | 25.47% | 24.61% | 21.46% | 20.61% | 26.10% | 27.72% | 34.65% | 44.45% | 44.12% | 37.10% | 33.67% | 61.04% | 44.83% |
| Operating Income | -13.25B | -4.55B | -14.96B | 29.19B | 26.75B | 21.19B | 16.75B | 12.29B | 11.47B | 14.16B | 11.13B | 10.04B | 11.01B | 9.29B | 6.00B | 2.13B | 5.66B | 3.10B |
| Operating Income Ratio | -22.28% | -7.21% | -13.88% | 21.56% | 23.99% | 24.78% | 23.79% | 20.74% | 19.87% | 25.25% | 26.82% | 35.02% | 42.30% | 42.64% | 35.22% | 29.58% | 61.04% | 44.83% |
| Total Other Income/Expenses | -8.99B | -13.00B | -6.61B | 3.40B | 2.26B | 1.45B | 1.94B | 901.64M | 2.25B | -415.03M | 722.85M | 130.07M | -258.48M | -719.65M | -288.33M | -343.26M | -54.19M | 240.05M |
| Income Before Tax | -22.24B | -17.55B | -21.57B | 33.59B | 29.02B | 22.64B | 18.69B | 13.20B | 13.72B | 15.26B | 13.06B | 10.17B | 10.75B | 8.57B | 5.71B | 1.79B | 5.61B | 3.34B |
| Income Before Tax Ratio | -37.41% | -27.84% | -20.01% | 24.82% | 26.02% | 26.47% | 26.54% | 22.26% | 23.77% | 27.20% | 31.47% | 35.48% | 41.30% | 39.33% | 33.53% | 24.81% | 60.46% | 48.30% |
| Income Tax Expense | 1.36B | 3.11B | 6.80B | 14.13B | 12.64B | 10.33B | 8.12B | 5.69B | 5.56B | 5.77B | 4.83B | 3.58B | 4.30B | 3.08B | 2.11B | 925.23M | 1.43B | 1.06B |
| Net Income | -21.03B | -21.49B | -27.09B | 12.63B | 10.90B | 8.83B | 7.84B | 5.17B | 6.12B | 8.10B | 7.39B | 5.76B | 5.72B | 4.67B | 3.51B | 841.16M | 4.17B | 2.28B |
| Net Income Ratio | -35.37% | -34.09% | -25.13% | 9.33% | 9.77% | 10.33% | 11.13% | 8.72% | 10.59% | 14.45% | 17.81% | 20.12% | 21.98% | 21.44% | 20.62% | 11.69% | 45.00% | 32.96% |
| EPS | -5.55 | -5.67 | -7.63 | 3.62 | 3.31 | 2.65 | 2.32 | 1.51 | 1.77 | 2.34 | 2.13 | 1.66 | 1.62 | 1.32 | 1.02 | 0.26 | 1.27 | 0.86 |
| EPS Diluted | -5.55 | -5.67 | -7.63 | 3.61 | 3.31 | 2.64 | 2.32 | 1.50 | 1.76 | 2.34 | 2.13 | 1.66 | 1.62 | 1.32 | 1.01 | 0.25 | 1.26 | 0.85 |
| Weighted Avg Shares Out | 3.79B | 3.79B | 3.55B | 3.49B | 3.29B | 3.34B | 3.37B | 3.43B | 3.46B | 3.46B | 3.47B | 3.47B | 3.53B | 3.54B | 3.45B | 3.29B | 3.21B | 2.67B |
| Weighted Avg Shares Out (Dil) | 3.79B | 3.79B | 3.55B | 3.50B | 3.30B | 3.34B | 3.38B | 3.44B | 3.47B | 3.46B | 3.47B | 3.47B | 3.53B | 3.55B | 3.46B | 3.31B | 3.24B | 2.68B |

Shimao Group latest Chinese developer to face liquidation event

Shimao Group latest Chinese developer to face liquidation event

Shimao Shares Fall After China Bank Files Liquidation Petition
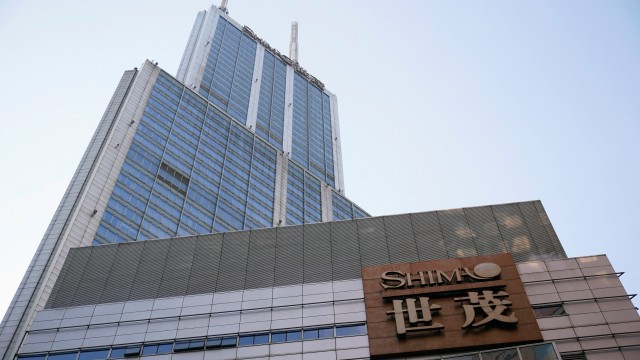
China's Shimao faces liquidation suit over failure to pay $202 million loan
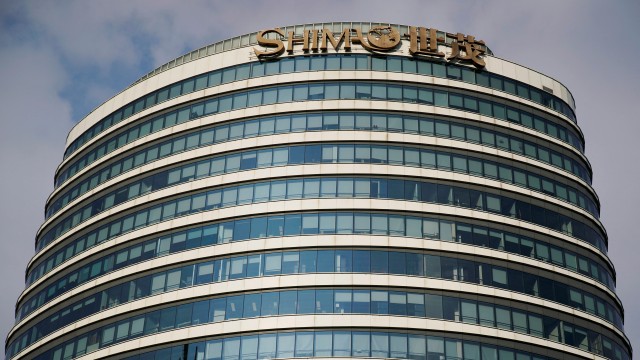
Exclusive: Deutsche Bank to file liquidation suit against Chinese developer Shimao, sources say
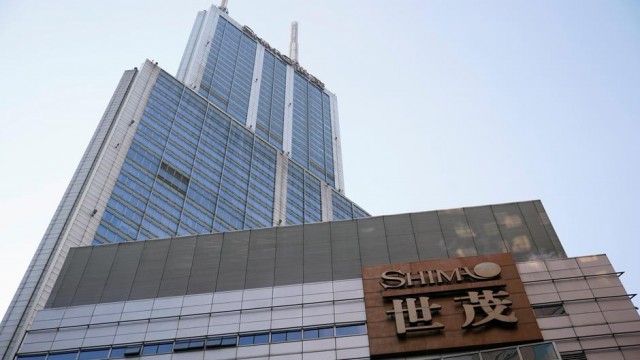
China developer Shimao looks to repay $11.8 billion debt over 3-8 years -sources

Chinese property developer Shimao misses payment on bond
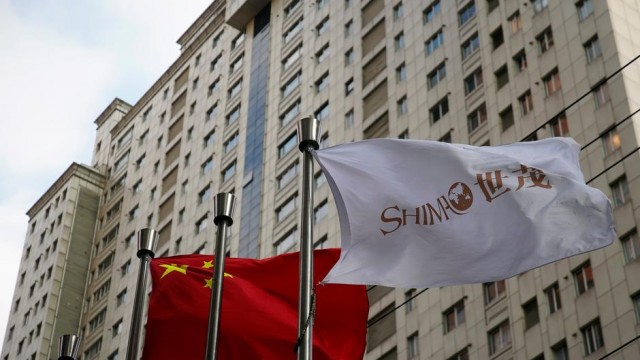
Chinese property developer Shimao misses repayment on $1 billion bond
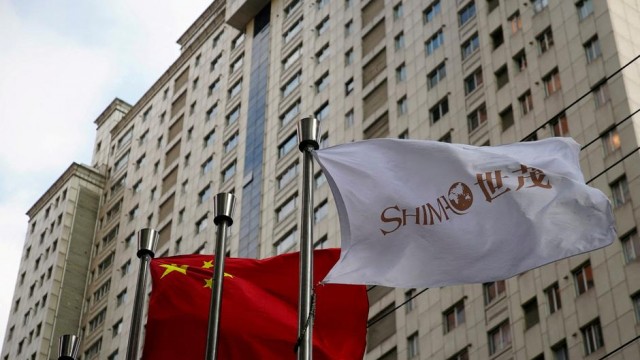
Chinese developer Shimao-guaranteed $174 million notes due March may not be redeemed - trustee
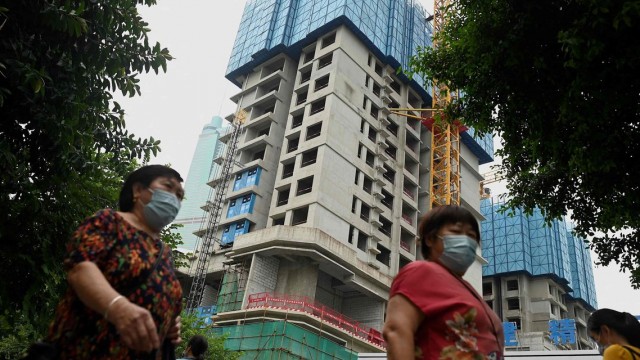
Chinese developer Shimao slips on loan payment delay plans, asset freeze reports
Source: https://incomestatements.info
Category: Stock Reports
