See more : TH International Limited (THCH) Income Statement Analysis – Financial Results
Complete financial analysis of Trillion Energy International Inc. (TCFF) income statement, including revenue, profit margins, EPS and key performance metrics. Get detailed insights into the financial performance of Trillion Energy International Inc., a leading company in the Oil & Gas Exploration & Production industry within the Energy sector.
- Orchid Ventures, Inc. (ORCD.CN) Income Statement Analysis – Financial Results
- Decker Manufacturing Corporation (DMFG) Income Statement Analysis – Financial Results
- Oasis Securities Limited (OASISEC.BO) Income Statement Analysis – Financial Results
- Outokumpu Oyj (OUTFF) Income Statement Analysis – Financial Results
- Arbor Rapha Capital Bioholdings Corp. I (ARCKW) Income Statement Analysis – Financial Results
Trillion Energy International Inc. (TCFF)
About Trillion Energy International Inc.
Trillion Energy International Inc. operates as an oil and gas producing company with assets in Turkey and Bulgaria. The company owns 49% interests in the SASB natural gas field; a 19.6% ownership interest in the Cendere oil field; and the Vranino 1-11 block, a prospective unconventional natural gas property in Bulgaria. The company was formerly known as Park Place Energy Inc. and changed its name to Trillion Energy International Inc. in April 2019. Trillion Energy International Inc. was founded in 2006 and is headquartered in Vancouver, Canada.
| Metric | 2020 | 2019 | 2018 | 2017 | 2016 | 2015 | 2014 | 2013 | 2012 | 2011 | 2010 | 2009 | 2008 | 2007 | 2006 | 2005 | 2004 |
|---|---|---|---|---|---|---|---|---|---|---|---|---|---|---|---|---|---|
| Revenue | 0.00 | 3.92M | 4.25M | 3.88M | 0.00 | 0.00 | 0.00 | 0.00 | 0.00 | 30.00K | 0.00 | 310.00K | 1.10M | 32.78K | 229.00 | 457.00 | 0.00 |
| Cost of Revenue | 0.00 | 2.59M | 2.80M | 2.81M | 0.00 | 0.00 | 0.00 | 0.00 | 0.00 | 40.00K | 0.00 | 590.00K | 1.56M | 22.01K | 0.00 | 0.00 | 0.00 |
| Gross Profit | 0.00 | 1.32M | 1.45M | 1.07M | 0.00 | 0.00 | 0.00 | 0.00 | 0.00 | -10.00K | 0.00 | -280.00K | -460.00K | 10.77K | 229.00 | 457.00 | 0.00 |
| Gross Profit Ratio | 0.00% | 33.78% | 34.12% | 27.51% | 0.00% | 0.00% | 0.00% | 0.00% | 0.00% | -33.33% | 0.00% | -90.32% | -41.82% | 32.85% | 100.00% | 100.00% | 0.00% |
| Research & Development | 0.00 | 0.00 | 0.00 | 0.00 | 0.00 | 0.00 | 0.00 | 0.00 | 0.00 | 0.00 | 0.00 | 0.00 | 290.00K | 0.00 | 0.00 | 279.00 | 703.30 |
| General & Administrative | 6.79K | 2.22M | 2.46M | 2.51M | 3.99M | 830.00K | 0.00 | 835.39K | 270.00K | 300.00K | 630.00K | 690.00K | 2.09M | 3.10M | 0.00 | 0.00 | 0.00 |
| Selling & Marketing | 2.76M | 4.00 | 0.00 | 0.00 | -4.97K | 3.66K | 0.00 | -138.53K | -1.53K | -12.73K | 21.21K | 65.36K | -255.46K | -678.79K | 0.00 | 0.00 | 0.00 |
| SG&A | 2.76M | 2.22M | 2.46M | 2.51M | 3.99M | 833.66K | 813.16K | 696.86K | 268.47K | 287.27K | 651.21K | 755.36K | 1.83M | 2.42M | 66.21K | 32.90K | 14.63K |
| Other Expenses | -2.76M | 824.49K | 1.18M | 1.01M | 0.00 | 0.00 | 0.00 | 1.01K | -3.59K | 2.15K | 6.50K | 15.55K | -29.27K | 9.40K | 959.00 | 0.00 | 0.00 |
| Operating Expenses | 6.79K | 3.04M | 3.63M | 3.52M | 3.99M | 833.66K | 813.16K | 697.87K | 264.87K | 289.42K | 657.71K | 770.91K | 2.10M | 2.43M | 67.17K | 33.17K | 15.34K |
| Cost & Expenses | 6.79K | 5.64M | 6.44M | 6.35M | 3.99M | 710.00K | 813.16K | 715.39K | 270.00K | 410.00K | 340.00K | 2.24M | 5.68M | 2.45M | 67.17K | 34.63K | 15.34K |
| Interest Income | 13.03K | 29.78K | 0.00 | 0.00 | 2.42K | 0.00 | 0.00 | 0.00 | 0.00 | 0.00 | 67.35K | 22.42K | 2.99K | 3.34K | 0.00 | 0.00 | 0.00 |
| Interest Expense | 119.69K | 50.73K | 27.27K | 76.03K | 12.40K | -73.66K | 0.00 | 0.00 | 0.00 | 7.70K | 0.00 | 0.00 | 0.00 | 0.00 | 0.00 | 0.00 | -15.34K |
| Depreciation & Amortization | 37.63K | 76.41K | 729.63K | 21.39K | -2.58K | 73.66K | 0.00 | 1.01K | 1.81K | 2.15K | 1.51K | 1.16K | 726.38 | 9.40K | 959.00 | 1.45K | 0.00 |
| EBITDA | 95.29K | -1.56M | -1.62M | -2.39M | -3.99M | -760.00K | -813.16K | -763.09K | -258.19K | -530.15K | -268.49K | -1.58M | -4.87M | -2.31M | -65.98K | -35.61K | -15.34K |
| EBITDA Ratio | 0.00% | -39.75% | -38.06% | -61.53% | 0.00% | 0.00% | 0.00% | 0.00% | 0.00% | -1,767.18% | 0.00% | -509.30% | -442.66% | -7,036.16% | -28,811.79% | -7,792.78% | 0.00% |
| Operating Income | 57.65K | -1.63M | -2.35M | -2.41M | -3.99M | -833.66K | -813.16K | -764.10K | -260.00K | -532.30K | -270.00K | -1.58M | -4.87M | -2.32M | -66.94K | -37.07K | -15.34K |
| Operating Income Ratio | 0.00% | -41.70% | -55.21% | -62.09% | 0.00% | 0.00% | 0.00% | 0.00% | 0.00% | -1,774.33% | 0.00% | -509.68% | -442.73% | -7,064.83% | -29,230.57% | -8,110.50% | 0.00% |
| Total Other Income/Expenses | -119.69K | -50.73K | -27.27K | -76.03K | -14.97K | 73.66K | 0.00 | 0.00 | 0.00 | -7.70K | 0.00 | 0.00 | 0.00 | 0.00 | 0.00 | -5.79K | 0.00 |
| Income Before Tax | -62.03K | -1.68M | -2.38M | -2.49M | -4.00M | -760.00K | 0.00 | -764.10K | -260.00K | -540.00K | -270.00K | -1.58M | -4.87M | -2.32M | 0.00 | -42.86K | 0.00 |
| Income Before Tax Ratio | 0.00% | -42.99% | -55.85% | -64.04% | 0.00% | 0.00% | 0.00% | 0.00% | 0.00% | -1,800.00% | 0.00% | -509.68% | -442.73% | -7,064.83% | 0.00% | -9,377.90% | 0.00% |
| Income Tax Expense | 119.69K | 50.73K | 27.27K | 76.03K | 2.58K | -73.66K | 0.00 | 0.00 | 0.00 | 7.70K | 0.00 | 0.00 | 0.00 | -180.37K | 0.00 | -5.79K | 15.34K |
| Net Income | -181.72K | -1.73M | -2.40M | -2.56M | -4.00M | -686.34K | 0.00 | -764.10K | -260.00K | -547.70K | -270.00K | -1.58M | -4.87M | -2.14M | -66.94K | -37.07K | -15.34K |
| Net Income Ratio | 0.00% | -44.29% | -56.49% | -66.00% | 0.00% | 0.00% | 0.00% | 0.00% | 0.00% | -1,825.67% | 0.00% | -509.68% | -442.73% | -6,514.56% | -29,230.57% | -8,110.50% | 0.00% |
| EPS | 0.00 | -0.02 | -0.03 | -0.05 | -0.08 | -0.02 | 0.00 | -0.03 | -0.01 | -0.06 | -0.06 | -0.72 | -2.62 | -2.78 | -0.03 | -0.02 | -0.01 |
| EPS Diluted | 0.00 | -0.02 | -0.03 | -0.05 | -0.08 | -0.02 | 0.00 | -0.03 | -0.01 | -0.06 | -0.06 | -0.72 | -2.62 | -2.78 | -0.03 | -0.02 | -0.01 |
| Weighted Avg Shares Out | 96.77M | 83.85M | 70.62M | 56.00M | 50.46M | 45.73M | 39.75M | 24.60M | 20.67M | 9.68M | 4.19M | 2.21M | 1.86M | 768.03K | 1.93M | 1.60M | 1.60M |
| Weighted Avg Shares Out (Dil) | 96.77M | 83.85M | 70.62M | 56.00M | 50.46M | 45.73M | 39.75M | 24.60M | 20.67M | 9.68M | 4.19M | 2.21M | 1.86M | 768.03K | 1.93M | 1.60M | 1.60M |
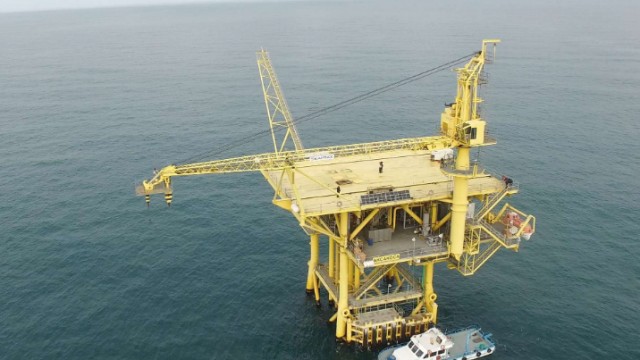
Trillion Energy International begins 3D seismic reprocessing project at SASB natural gas field
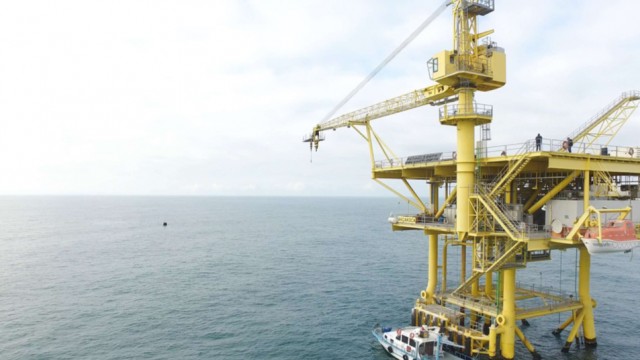
Trillion Energy says it's moving closer to bringing SASB field into production this year as energy markets strengthen

Trillion Energy redomiciles successfully from Delaware to British Columbia corporation
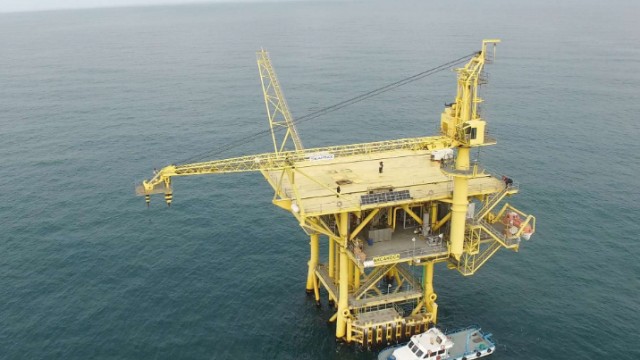
Trillion Energy International says ‘trifecta of circumstances' driving natural prices sharply higher
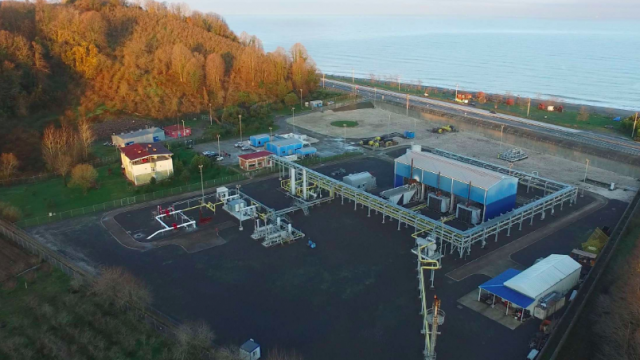
Trillion Energy International sees “significant” increase in SASB Gas field's NPV on rising commodity prices
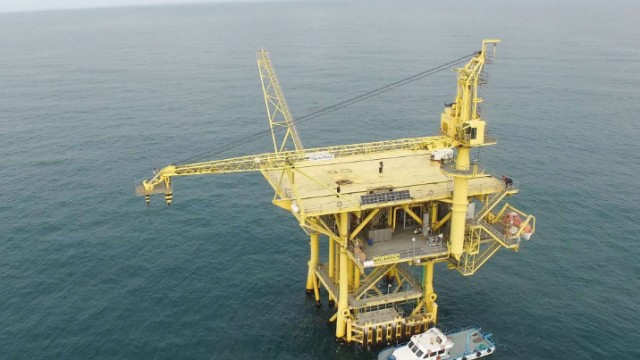
Trillion Energy International is quickly becoming an energy powerhouse in Eastern Europe
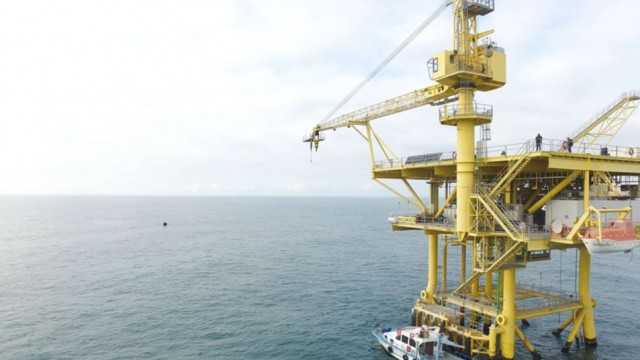
Trillion Energy International swings to $5.4M profit in 3Q as higher commodity prices boost performance at European oil and gas operations
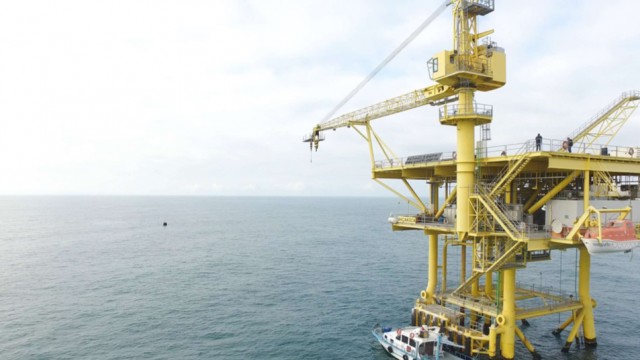
Trillion Energy International announces upcoming shareholder vote to move company to Canada

Trillion Announces Closing of Debt Settlement
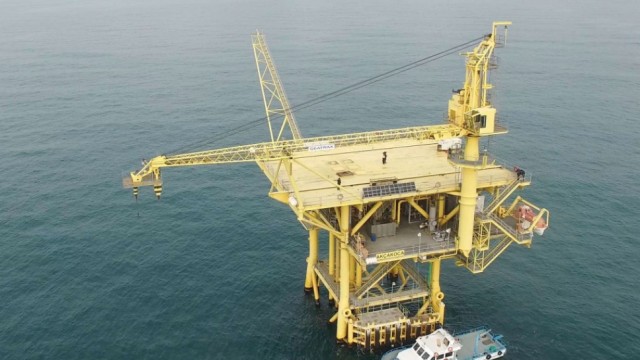
Trillion Energy International unveils plan to redomicile from Delaware, USA, to British Columbia, Canada
Source: https://incomestatements.info
Category: Stock Reports
