See more : Realcan Pharmaceutical Group Co., Ltd. (002589.SZ) Income Statement Analysis – Financial Results
Complete financial analysis of Trillion Energy International Inc. (TCFF) income statement, including revenue, profit margins, EPS and key performance metrics. Get detailed insights into the financial performance of Trillion Energy International Inc., a leading company in the Oil & Gas Exploration & Production industry within the Energy sector.
- MCH Group AG (MCHN.SW) Income Statement Analysis – Financial Results
- GN Store Nord A/S (GNNDY) Income Statement Analysis – Financial Results
- Morgan Stanley (MS-PA) Income Statement Analysis – Financial Results
- Comerica Incorporated (0I1P.L) Income Statement Analysis – Financial Results
- Meltronix, Inc. (MTNX) Income Statement Analysis – Financial Results
Trillion Energy International Inc. (TCFF)
About Trillion Energy International Inc.
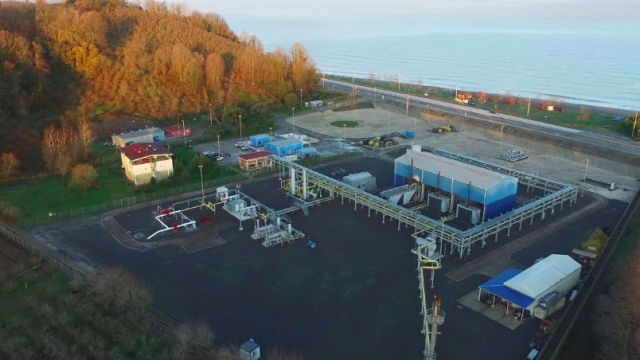
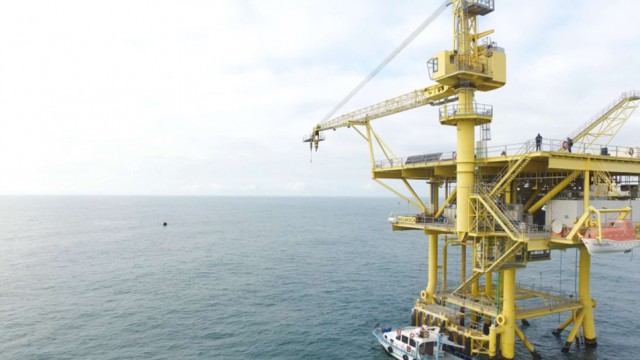
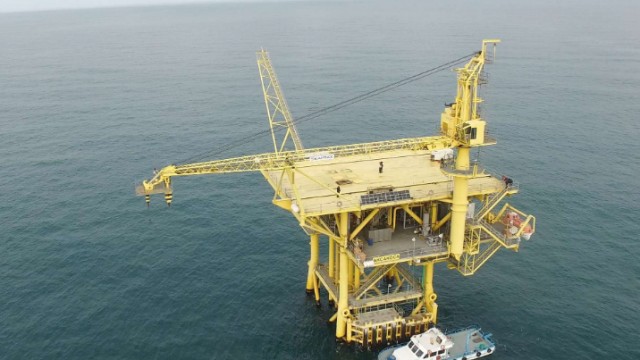
Trillion Energy International Inc. operates as an oil and gas producing company with assets in Turkey and Bulgaria. The company owns 49% interests in the SASB natural gas field; a 19.6% ownership interest in the Cendere oil field; and the Vranino 1-11 block, a prospective unconventional natural gas property in Bulgaria. The company was formerly known as Park Place Energy Inc. and changed its name to Trillion Energy International Inc. in April 2019. Trillion Energy International Inc. was founded in 2006 and is headquartered in Vancouver, Canada.
| Metric | 2020 | 2019 | 2018 | 2017 | 2016 | 2015 | 2014 | 2013 | 2012 | 2011 | 2010 | 2009 | 2008 | 2007 | 2006 | 2005 | 2004 |
|---|---|---|---|---|---|---|---|---|---|---|---|---|---|---|---|---|---|
| Revenue | 0.00 | 3.92M | 4.25M | 3.88M | 0.00 | 0.00 | 0.00 | 0.00 | 0.00 | 30.00K | 0.00 | 310.00K | 1.10M | 32.78K | 229.00 | 457.00 | 0.00 |
| Cost of Revenue | 0.00 | 2.59M | 2.80M | 2.81M | 0.00 | 0.00 | 0.00 | 0.00 | 0.00 | 40.00K | 0.00 | 590.00K | 1.56M | 22.01K | 0.00 | 0.00 | 0.00 |
| Gross Profit | 0.00 | 1.32M | 1.45M | 1.07M | 0.00 | 0.00 | 0.00 | 0.00 | 0.00 | -10.00K | 0.00 | -280.00K | -460.00K | 10.77K | 229.00 | 457.00 | 0.00 |
| Gross Profit Ratio | 0.00% | 33.78% | 34.12% | 27.51% | 0.00% | 0.00% | 0.00% | 0.00% | 0.00% | -33.33% | 0.00% | -90.32% | -41.82% | 32.85% | 100.00% | 100.00% | 0.00% |
| Research & Development | 0.00 | 0.00 | 0.00 | 0.00 | 0.00 | 0.00 | 0.00 | 0.00 | 0.00 | 0.00 | 0.00 | 0.00 | 290.00K | 0.00 | 0.00 | 279.00 | 703.30 |
| General & Administrative | 6.79K | 2.22M | 2.46M | 2.51M | 3.99M | 830.00K | 0.00 | 835.39K | 270.00K | 300.00K | 630.00K | 690.00K | 2.09M | 3.10M | 0.00 | 0.00 | 0.00 |
| Selling & Marketing | 2.76M | 4.00 | 0.00 | 0.00 | -4.97K | 3.66K | 0.00 | -138.53K | -1.53K | -12.73K | 21.21K | 65.36K | -255.46K | -678.79K | 0.00 | 0.00 | 0.00 |
| SG&A | 2.76M | 2.22M | 2.46M | 2.51M | 3.99M | 833.66K | 813.16K | 696.86K | 268.47K | 287.27K | 651.21K | 755.36K | 1.83M | 2.42M | 66.21K | 32.90K | 14.63K |
| Other Expenses | -2.76M | 824.49K | 1.18M | 1.01M | 0.00 | 0.00 | 0.00 | 1.01K | -3.59K | 2.15K | 6.50K | 15.55K | -29.27K | 9.40K | 959.00 | 0.00 | 0.00 |
| Operating Expenses | 6.79K | 3.04M | 3.63M | 3.52M | 3.99M | 833.66K | 813.16K | 697.87K | 264.87K | 289.42K | 657.71K | 770.91K | 2.10M | 2.43M | 67.17K | 33.17K | 15.34K |
| Cost & Expenses | 6.79K | 5.64M | 6.44M | 6.35M | 3.99M | 710.00K | 813.16K | 715.39K | 270.00K | 410.00K | 340.00K | 2.24M | 5.68M | 2.45M | 67.17K | 34.63K | 15.34K |
| Interest Income | 13.03K | 29.78K | 0.00 | 0.00 | 2.42K | 0.00 | 0.00 | 0.00 | 0.00 | 0.00 | 67.35K | 22.42K | 2.99K | 3.34K | 0.00 | 0.00 | 0.00 |
| Interest Expense | 119.69K | 50.73K | 27.27K | 76.03K | 12.40K | -73.66K | 0.00 | 0.00 | 0.00 | 7.70K | 0.00 | 0.00 | 0.00 | 0.00 | 0.00 | 0.00 | -15.34K |
| Depreciation & Amortization | 37.63K | 76.41K | 729.63K | 21.39K | -2.58K | 73.66K | 0.00 | 1.01K | 1.81K | 2.15K | 1.51K | 1.16K | 726.38 | 9.40K | 959.00 | 1.45K | 0.00 |
| EBITDA | 95.29K | -1.56M | -1.62M | -2.39M | -3.99M | -760.00K | -813.16K | -763.09K | -258.19K | -530.15K | -268.49K | -1.58M | -4.87M | -2.31M | -65.98K | -35.61K | -15.34K |
| EBITDA Ratio | 0.00% | -39.75% | -38.06% | -61.53% | 0.00% | 0.00% | 0.00% | 0.00% | 0.00% | -1,767.18% | 0.00% | -509.30% | -442.66% | -7,036.16% | -28,811.79% | -7,792.78% | 0.00% |
| Operating Income | 57.65K | -1.63M | -2.35M | -2.41M | -3.99M | -833.66K | -813.16K | -764.10K | -260.00K | -532.30K | -270.00K | -1.58M | -4.87M | -2.32M | -66.94K | -37.07K | -15.34K |
| Operating Income Ratio | 0.00% | -41.70% | -55.21% | -62.09% | 0.00% | 0.00% | 0.00% | 0.00% | 0.00% | -1,774.33% | 0.00% | -509.68% | -442.73% | -7,064.83% | -29,230.57% | -8,110.50% | 0.00% |
| Total Other Income/Expenses | -119.69K | -50.73K | -27.27K | -76.03K | -14.97K | 73.66K | 0.00 | 0.00 | 0.00 | -7.70K | 0.00 | 0.00 | 0.00 | 0.00 | 0.00 | -5.79K | 0.00 |
| Income Before Tax | -62.03K | -1.68M | -2.38M | -2.49M | -4.00M | -760.00K | 0.00 | -764.10K | -260.00K | -540.00K | -270.00K | -1.58M | -4.87M | -2.32M | 0.00 | -42.86K | 0.00 |
| Income Before Tax Ratio | 0.00% | -42.99% | -55.85% | -64.04% | 0.00% | 0.00% | 0.00% | 0.00% | 0.00% | -1,800.00% | 0.00% | -509.68% | -442.73% | -7,064.83% | 0.00% | -9,377.90% | 0.00% |
| Income Tax Expense | 119.69K | 50.73K | 27.27K | 76.03K | 2.58K | -73.66K | 0.00 | 0.00 | 0.00 | 7.70K | 0.00 | 0.00 | 0.00 | -180.37K | 0.00 | -5.79K | 15.34K |
| Net Income | -181.72K | -1.73M | -2.40M | -2.56M | -4.00M | -686.34K | 0.00 | -764.10K | -260.00K | -547.70K | -270.00K | -1.58M | -4.87M | -2.14M | -66.94K | -37.07K | -15.34K |
| Net Income Ratio | 0.00% | -44.29% | -56.49% | -66.00% | 0.00% | 0.00% | 0.00% | 0.00% | 0.00% | -1,825.67% | 0.00% | -509.68% | -442.73% | -6,514.56% | -29,230.57% | -8,110.50% | 0.00% |
| EPS | 0.00 | -0.02 | -0.03 | -0.05 | -0.08 | -0.02 | 0.00 | -0.03 | -0.01 | -0.06 | -0.06 | -0.72 | -2.62 | -2.78 | -0.03 | -0.02 | -0.01 |
| EPS Diluted | 0.00 | -0.02 | -0.03 | -0.05 | -0.08 | -0.02 | 0.00 | -0.03 | -0.01 | -0.06 | -0.06 | -0.72 | -2.62 | -2.78 | -0.03 | -0.02 | -0.01 |
| Weighted Avg Shares Out | 96.77M | 83.85M | 70.62M | 56.00M | 50.46M | 45.73M | 39.75M | 24.60M | 20.67M | 9.68M | 4.19M | 2.21M | 1.86M | 768.03K | 1.93M | 1.60M | 1.60M |
| Weighted Avg Shares Out (Dil) | 96.77M | 83.85M | 70.62M | 56.00M | 50.46M | 45.73M | 39.75M | 24.60M | 20.67M | 9.68M | 4.19M | 2.21M | 1.86M | 768.03K | 1.93M | 1.60M | 1.60M |

Trillion Energy Corporate Update And Mid-Year Results

Trillion Energy presenting at Emerging Growth Conference on July 21, 2021

Trillion Energy says it is benefitting from rising petroleum prices

TRILLION ENERGY benefits from rising petroleum prices

Trillion Energy kicks off SASB gas development project in the Black Sea

Trillion Energy Starts the SASB Gas Development Project

Trillion to present at the Emerging Growth Conference on June 9, 2021

CORRECTING and REPLACING -- Trillion Energy Signs Letter of Intent for USD $17.5 Million in Debt and Royalty Financing

Trillion Energy signs LOI with US investment fund to obtain up to US$17.5M in new financing

Trillion Energy kicks off work program to expand SASB license area in the Black Sea
Source: https://incomestatements.info
Category: Stock Reports
