See more : Beauty Kadan Holdings Co., Ltd. (3041.T) Income Statement Analysis – Financial Results
Complete financial analysis of Verso Corporation (VRS) income statement, including revenue, profit margins, EPS and key performance metrics. Get detailed insights into the financial performance of Verso Corporation, a leading company in the Paper, Lumber & Forest Products industry within the Basic Materials sector.
- Sterling Bancorp, Inc. (Southfield, MI) (SBT) Income Statement Analysis – Financial Results
- Saputo Inc. (SAPIF) Income Statement Analysis – Financial Results
- Broncus Holding Corporation (BRNHF) Income Statement Analysis – Financial Results
- SheerVision, Inc. (SVSO) Income Statement Analysis – Financial Results
- Geodrill Limited (GEODF) Income Statement Analysis – Financial Results
Verso Corporation (VRS)
About Verso Corporation
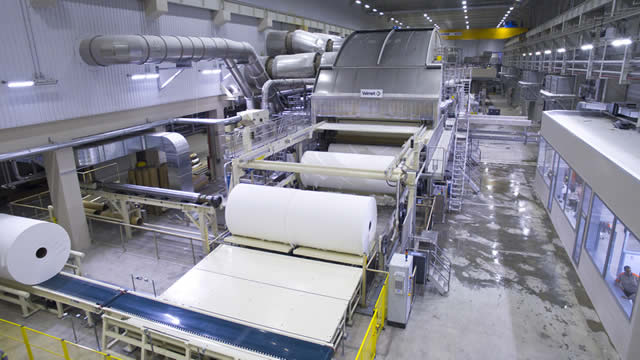
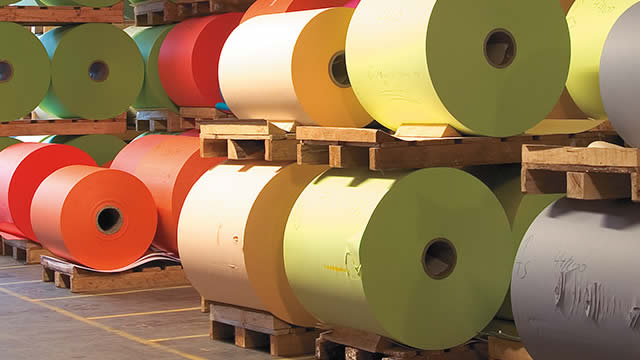
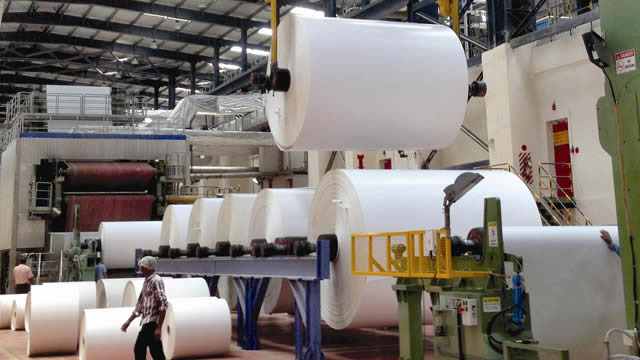
Verso Corporation produces and sells coated papers in North America. It operates through two segments, Paper and Pulp. The company offers coated and uncoated freesheet, coated groundwood, supercalendered, specialty, and packaging papers; and pulp to manufacture printing, writing and specialty paper grades, and tissue and other products. Its paper products are used primarily in media, marketing, commercial printing, catalogs, magazines, high-end advertising brochures, and direct-mail advertising applications, as well as specialty applications, such as labeling and other special applications. The company was formerly known as Verso Paper Corp. and changed its name to Verso Corporation in January 2015. Verso Corporation was incorporated in 2006 and is based in Miamisburg, Ohio.
| Metric | 2021 | 2020 | 2019 | 2018 | 2017 | 2016 | 2015 | 2014 | 2013 | 2012 | 2011 | 2010 | 2009 | 2008 | 2007 | 2006 | 2005 | 2004 | 2003 |
|---|---|---|---|---|---|---|---|---|---|---|---|---|---|---|---|---|---|---|---|
| Revenue | 1.28B | 1.36B | 2.44B | 2.68B | 2.46B | 0.00 | 3.12B | 1.30B | 1.39B | 1.47B | 1.72B | 1.61B | 1.36B | 1.77B | 1.63B | 706.83M | 1.60B | 1.46B | 1.34B |
| Cost of Revenue | 1.06B | 1.33B | 2.14B | 2.32B | 2.24B | 0.00 | 2.73B | 1.18B | 1.18B | 1.27B | 1.46B | 1.41B | 1.24B | 1.46B | 1.40B | 589.28M | 0.00 | 0.00 | 0.00 |
| Gross Profit | 216.00M | 25.00M | 306.00M | 361.00M | 224.00M | 0.00 | 395.00M | 120.61M | 209.81M | 201.98M | 262.20M | 194.55M | 118.11M | 303.64M | 225.70M | 117.55M | 1.60B | 1.46B | 1.34B |
| Gross Profit Ratio | 16.90% | 1.84% | 12.52% | 13.46% | 9.10% | 0.00% | 12.65% | 9.30% | 15.11% | 13.70% | 15.22% | 12.12% | 8.68% | 17.19% | 13.86% | 16.63% | 100.00% | 100.00% | 100.00% |
| Research & Development | 0.00 | 0.00 | 0.00 | 0.00 | 0.00 | 0.00 | 0.00 | 0.00 | 0.00 | 0.00 | 0.00 | 0.00 | 0.00 | 0.00 | 0.00 | 0.00 | 0.00 | 0.00 | 0.00 |
| General & Administrative | 0.00 | 77.00M | 104.00M | 102.00M | 106.00M | 0.00 | 187.00M | 69.95M | 73.78M | 74.42M | 78.06M | 71.04M | 61.89M | 79.74M | 0.00 | 0.00 | 0.00 | 0.00 | 0.00 |
| Selling & Marketing | 0.00 | 0.00 | 0.00 | 0.00 | 0.00 | 0.00 | 0.00 | 0.00 | 0.00 | 0.00 | 0.00 | 0.00 | 0.00 | 0.00 | 0.00 | 0.00 | 0.00 | 0.00 | 0.00 |
| SG&A | 76.00M | 77.00M | 104.00M | 102.00M | 106.00M | 0.00 | 187.00M | 69.95M | 73.78M | 74.42M | 78.06M | 71.04M | 61.89M | 79.74M | 53.17M | 14.39M | 65.57M | 65.30M | 81.40M |
| Other Expenses | 146.00M | 64.00M | 187.00M | 106.00M | 116.00M | 0.00 | 309.00M | 90.90M | 100.76M | 57.58M | 125.30M | 127.37M | 132.68M | 134.46M | 123.17M | 48.33M | -1.61B | -1.53B | -1.46B |
| Operating Expenses | 222.00M | 141.00M | 291.00M | 208.00M | 222.00M | 0.00 | 496.00M | 160.84M | 174.54M | 132.00M | 203.35M | 198.41M | 194.57M | 214.20M | 176.33M | 62.72M | -1.54B | -1.47B | -1.38B |
| Cost & Expenses | 1.28B | 1.48B | 2.43B | 2.53B | 2.46B | 0.00 | 3.22B | 1.34B | 1.35B | 1.40B | 1.66B | 1.61B | 1.44B | 1.68B | 1.58B | 652.01M | 1.53B | 1.47B | 1.37B |
| Interest Income | 0.00 | 0.00 | 0.00 | 0.00 | 0.00 | 0.00 | 0.00 | 2.00K | 25.00K | 8.00K | 99.00K | 120.00K | 246.00K | 770.00K | 1.54M | 1.80M | -39.00K | -300.00K | -100.00K |
| Interest Expense | 2.00M | 1.00M | 2.00M | 33.00M | 38.00M | 0.00 | 270.00M | 142.33M | 137.73M | 135.46M | 126.61M | 128.08M | 123.37M | 125.62M | 142.98M | 49.14M | 14.82M | 16.00M | 16.30M |
| Depreciation & Amortization | 154.00M | 153.00M | 183.00M | 111.00M | 52.52K | 193.00M | 0.00 | -38.90M | -7.94M | -7.37M | 132.36M | 127.37M | 132.68M | 770.00K | 129.94M | 50.62M | 129.36M | 1.40B | 1.29B |
| EBITDA | 150.00M | 44.00M | 164.00M | 315.00M | -7.00M | 0.00 | -155.00M | -213.61M | 25.96M | -39.79M | 122.11M | 124.51M | 362.80M | 62.80M | 161.45M | 97.12M | 189.64M | 1.40B | 1.26B |
| EBITDA Ratio | 11.74% | 3.24% | 6.71% | 11.74% | -0.28% | 0.00% | -4.96% | -16.47% | 1.87% | -2.70% | 7.09% | 7.76% | 26.66% | 3.55% | 9.91% | 13.74% | 11.82% | 95.52% | 93.56% |
| Operating Income | -4.00M | -128.00M | -37.00M | 152.00M | -7.00M | 0.00 | -155.00M | -174.72M | 33.90M | -32.42M | 15.69M | -3.86M | -77.44M | 62.03M | 29.97M | 44.70M | 60.25M | -5.60M | -35.20M |
| Operating Income Ratio | -0.31% | -9.42% | -1.51% | 5.67% | -0.28% | 0.00% | -4.96% | -13.47% | 2.44% | -2.20% | 0.91% | -0.24% | -5.69% | 3.51% | 1.84% | 6.32% | 3.76% | -0.38% | -2.62% |
| Total Other Income/Expenses | -2.00M | 18.00M | 16.00M | 19.00M | -31.00M | 0.00 | -270.00M | -181.23M | -145.67M | -142.83M | -152.55M | -127.07M | 184.19M | -124.85M | -141.43M | -47.34M | -14.78M | -15.70M | -16.20M |
| Income Before Tax | -6.00M | -110.00M | -21.00M | 171.00M | -38.00M | 0.00 | -425.00M | -355.94M | -111.77M | -175.25M | -136.86M | -130.94M | 106.75M | -62.83M | -111.46M | -2.64M | 45.46M | -21.30M | -51.40M |
| Income Before Tax Ratio | -0.47% | -8.09% | -0.86% | 6.38% | -1.54% | 0.00% | -13.61% | -27.45% | -8.05% | -11.88% | -7.95% | -8.16% | 7.84% | -3.56% | -6.84% | -0.37% | 2.83% | -1.46% | -3.83% |
| Income Tax Expense | -3.00M | -9.00M | -117.00M | 52.00M | -8.00M | 0.00 | -3.00M | -2.99M | -562.00K | -1.42M | 197.00K | 145.00K | 746.00K | 0.00 | 1.54M | 1.80M | 17.91M | -8.20M | -19.80M |
| Net Income | -3.00M | -101.00M | 96.00M | 171.00M | -30.00M | 0.00 | -422.00M | -352.96M | -111.21M | -173.83M | -137.06M | -131.08M | 106.00M | -62.83M | -111.46M | -2.64M | 27.55M | -13.10M | -32.30M |
| Net Income Ratio | -0.23% | -7.43% | 3.93% | 6.38% | -1.22% | 0.00% | -13.52% | -27.22% | -8.01% | -11.79% | -7.96% | -8.17% | 7.79% | -3.56% | -6.84% | -0.37% | 1.72% | -0.90% | -2.40% |
| EPS | -0.09 | -2.95 | 2.73 | 4.87 | -0.87 | 0.00 | -5.19 | -6.62 | -2.09 | -3.29 | -2.61 | -2.50 | 2.03 | -1.35 | -2.93 | -0.07 | 0.34 | -0.16 | -0.39 |
| EPS Diluted | -0.09 | -2.95 | 2.73 | 4.87 | -0.87 | 0.00 | -5.19 | -6.62 | -2.09 | -3.29 | -2.61 | -2.50 | 2.03 | -1.35 | -2.93 | -0.07 | 0.34 | -0.16 | -0.39 |
| Weighted Avg Shares Out | 34.23M | 34.23M | 35.13M | 35.10M | 34.43M | 34.43M | 81.30M | 53.29M | 53.17M | 52.90M | 52.60M | 52.45M | 52.14M | 46.69M | 38.05M | 38.05M | 81.85M | 81.85M | 81.85M |
| Weighted Avg Shares Out (Dil) | 34.23M | 34.23M | 35.13M | 35.10M | 34.43M | 34.43M | 81.30M | 53.29M | 53.17M | 52.90M | 52.60M | 52.45M | 52.15M | 46.69M | 38.05M | 38.05M | 81.85M | 81.85M | 81.85M |

Oxford Instruments Asylum Research Releases New Vero VRS1250 Atomic Force Microscope

Verso (VRS) Gets Shareholders' Nod for Merger Agreement

Verso (VRS) Q4 Revenues and Earnings Beat Estimates, Up Y/Y

Verso (VRS) Q4 Earnings and Revenues Surpass Estimates

Verso (VRS) Flat As Market Sinks: What You Should Know

Fast-paced Momentum Stock Verso (VRS) Is Still Trading at a Bargain

Verso (VRS) Stock Sinks As Market Gains: What You Should Know

Best Momentum Stocks to Buy for December 31st

Are You Looking for a Top Momentum Pick? Why Verso (VRS) is a Great Choice

Best Momentum Stocks to Buy for December 22nd
Source: https://incomestatements.info
Category: Stock Reports
