See more : Ace Software Exports Limited (ACESOFT.BO) Income Statement Analysis – Financial Results
Complete financial analysis of Verso Corporation (VRS) income statement, including revenue, profit margins, EPS and key performance metrics. Get detailed insights into the financial performance of Verso Corporation, a leading company in the Paper, Lumber & Forest Products industry within the Basic Materials sector.
- BeNext-Yumeshin Group Co. (2154.T) Income Statement Analysis – Financial Results
- Paragon Finance Limited (PARAGONF.BO) Income Statement Analysis – Financial Results
- AUTOWAVE Co., Ltd. (2666.T) Income Statement Analysis – Financial Results
- MyBucks S.A. (MBC.DE) Income Statement Analysis – Financial Results
- Zumtobel Group AG (ZMTBY) Income Statement Analysis – Financial Results
Verso Corporation (VRS)
About Verso Corporation
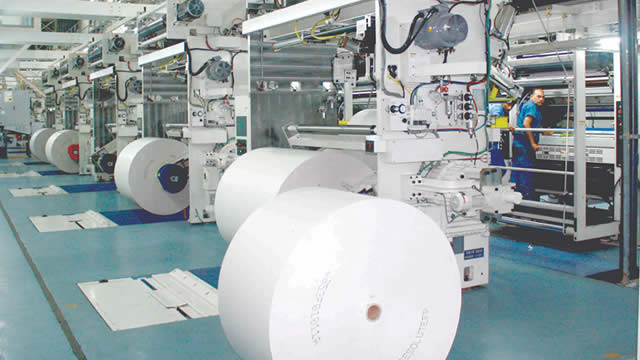
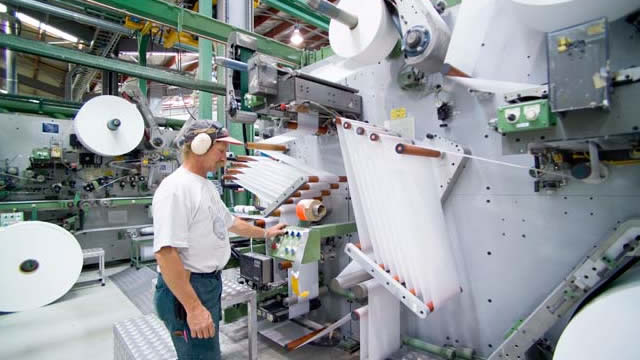
Verso Corporation produces and sells coated papers in North America. It operates through two segments, Paper and Pulp. The company offers coated and uncoated freesheet, coated groundwood, supercalendered, specialty, and packaging papers; and pulp to manufacture printing, writing and specialty paper grades, and tissue and other products. Its paper products are used primarily in media, marketing, commercial printing, catalogs, magazines, high-end advertising brochures, and direct-mail advertising applications, as well as specialty applications, such as labeling and other special applications. The company was formerly known as Verso Paper Corp. and changed its name to Verso Corporation in January 2015. Verso Corporation was incorporated in 2006 and is based in Miamisburg, Ohio.
| Metric | 2021 | 2020 | 2019 | 2018 | 2017 | 2016 | 2015 | 2014 | 2013 | 2012 | 2011 | 2010 | 2009 | 2008 | 2007 | 2006 | 2005 | 2004 | 2003 |
|---|---|---|---|---|---|---|---|---|---|---|---|---|---|---|---|---|---|---|---|
| Revenue | 1.28B | 1.36B | 2.44B | 2.68B | 2.46B | 0.00 | 3.12B | 1.30B | 1.39B | 1.47B | 1.72B | 1.61B | 1.36B | 1.77B | 1.63B | 706.83M | 1.60B | 1.46B | 1.34B |
| Cost of Revenue | 1.06B | 1.33B | 2.14B | 2.32B | 2.24B | 0.00 | 2.73B | 1.18B | 1.18B | 1.27B | 1.46B | 1.41B | 1.24B | 1.46B | 1.40B | 589.28M | 0.00 | 0.00 | 0.00 |
| Gross Profit | 216.00M | 25.00M | 306.00M | 361.00M | 224.00M | 0.00 | 395.00M | 120.61M | 209.81M | 201.98M | 262.20M | 194.55M | 118.11M | 303.64M | 225.70M | 117.55M | 1.60B | 1.46B | 1.34B |
| Gross Profit Ratio | 16.90% | 1.84% | 12.52% | 13.46% | 9.10% | 0.00% | 12.65% | 9.30% | 15.11% | 13.70% | 15.22% | 12.12% | 8.68% | 17.19% | 13.86% | 16.63% | 100.00% | 100.00% | 100.00% |
| Research & Development | 0.00 | 0.00 | 0.00 | 0.00 | 0.00 | 0.00 | 0.00 | 0.00 | 0.00 | 0.00 | 0.00 | 0.00 | 0.00 | 0.00 | 0.00 | 0.00 | 0.00 | 0.00 | 0.00 |
| General & Administrative | 0.00 | 77.00M | 104.00M | 102.00M | 106.00M | 0.00 | 187.00M | 69.95M | 73.78M | 74.42M | 78.06M | 71.04M | 61.89M | 79.74M | 0.00 | 0.00 | 0.00 | 0.00 | 0.00 |
| Selling & Marketing | 0.00 | 0.00 | 0.00 | 0.00 | 0.00 | 0.00 | 0.00 | 0.00 | 0.00 | 0.00 | 0.00 | 0.00 | 0.00 | 0.00 | 0.00 | 0.00 | 0.00 | 0.00 | 0.00 |
| SG&A | 76.00M | 77.00M | 104.00M | 102.00M | 106.00M | 0.00 | 187.00M | 69.95M | 73.78M | 74.42M | 78.06M | 71.04M | 61.89M | 79.74M | 53.17M | 14.39M | 65.57M | 65.30M | 81.40M |
| Other Expenses | 146.00M | 64.00M | 187.00M | 106.00M | 116.00M | 0.00 | 309.00M | 90.90M | 100.76M | 57.58M | 125.30M | 127.37M | 132.68M | 134.46M | 123.17M | 48.33M | -1.61B | -1.53B | -1.46B |
| Operating Expenses | 222.00M | 141.00M | 291.00M | 208.00M | 222.00M | 0.00 | 496.00M | 160.84M | 174.54M | 132.00M | 203.35M | 198.41M | 194.57M | 214.20M | 176.33M | 62.72M | -1.54B | -1.47B | -1.38B |
| Cost & Expenses | 1.28B | 1.48B | 2.43B | 2.53B | 2.46B | 0.00 | 3.22B | 1.34B | 1.35B | 1.40B | 1.66B | 1.61B | 1.44B | 1.68B | 1.58B | 652.01M | 1.53B | 1.47B | 1.37B |
| Interest Income | 0.00 | 0.00 | 0.00 | 0.00 | 0.00 | 0.00 | 0.00 | 2.00K | 25.00K | 8.00K | 99.00K | 120.00K | 246.00K | 770.00K | 1.54M | 1.80M | -39.00K | -300.00K | -100.00K |
| Interest Expense | 2.00M | 1.00M | 2.00M | 33.00M | 38.00M | 0.00 | 270.00M | 142.33M | 137.73M | 135.46M | 126.61M | 128.08M | 123.37M | 125.62M | 142.98M | 49.14M | 14.82M | 16.00M | 16.30M |
| Depreciation & Amortization | 154.00M | 153.00M | 183.00M | 111.00M | 52.52K | 193.00M | 0.00 | -38.90M | -7.94M | -7.37M | 132.36M | 127.37M | 132.68M | 770.00K | 129.94M | 50.62M | 129.36M | 1.40B | 1.29B |
| EBITDA | 150.00M | 44.00M | 164.00M | 315.00M | -7.00M | 0.00 | -155.00M | -213.61M | 25.96M | -39.79M | 122.11M | 124.51M | 362.80M | 62.80M | 161.45M | 97.12M | 189.64M | 1.40B | 1.26B |
| EBITDA Ratio | 11.74% | 3.24% | 6.71% | 11.74% | -0.28% | 0.00% | -4.96% | -16.47% | 1.87% | -2.70% | 7.09% | 7.76% | 26.66% | 3.55% | 9.91% | 13.74% | 11.82% | 95.52% | 93.56% |
| Operating Income | -4.00M | -128.00M | -37.00M | 152.00M | -7.00M | 0.00 | -155.00M | -174.72M | 33.90M | -32.42M | 15.69M | -3.86M | -77.44M | 62.03M | 29.97M | 44.70M | 60.25M | -5.60M | -35.20M |
| Operating Income Ratio | -0.31% | -9.42% | -1.51% | 5.67% | -0.28% | 0.00% | -4.96% | -13.47% | 2.44% | -2.20% | 0.91% | -0.24% | -5.69% | 3.51% | 1.84% | 6.32% | 3.76% | -0.38% | -2.62% |
| Total Other Income/Expenses | -2.00M | 18.00M | 16.00M | 19.00M | -31.00M | 0.00 | -270.00M | -181.23M | -145.67M | -142.83M | -152.55M | -127.07M | 184.19M | -124.85M | -141.43M | -47.34M | -14.78M | -15.70M | -16.20M |
| Income Before Tax | -6.00M | -110.00M | -21.00M | 171.00M | -38.00M | 0.00 | -425.00M | -355.94M | -111.77M | -175.25M | -136.86M | -130.94M | 106.75M | -62.83M | -111.46M | -2.64M | 45.46M | -21.30M | -51.40M |
| Income Before Tax Ratio | -0.47% | -8.09% | -0.86% | 6.38% | -1.54% | 0.00% | -13.61% | -27.45% | -8.05% | -11.88% | -7.95% | -8.16% | 7.84% | -3.56% | -6.84% | -0.37% | 2.83% | -1.46% | -3.83% |
| Income Tax Expense | -3.00M | -9.00M | -117.00M | 52.00M | -8.00M | 0.00 | -3.00M | -2.99M | -562.00K | -1.42M | 197.00K | 145.00K | 746.00K | 0.00 | 1.54M | 1.80M | 17.91M | -8.20M | -19.80M |
| Net Income | -3.00M | -101.00M | 96.00M | 171.00M | -30.00M | 0.00 | -422.00M | -352.96M | -111.21M | -173.83M | -137.06M | -131.08M | 106.00M | -62.83M | -111.46M | -2.64M | 27.55M | -13.10M | -32.30M |
| Net Income Ratio | -0.23% | -7.43% | 3.93% | 6.38% | -1.22% | 0.00% | -13.52% | -27.22% | -8.01% | -11.79% | -7.96% | -8.17% | 7.79% | -3.56% | -6.84% | -0.37% | 1.72% | -0.90% | -2.40% |
| EPS | -0.09 | -2.95 | 2.73 | 4.87 | -0.87 | 0.00 | -5.19 | -6.62 | -2.09 | -3.29 | -2.61 | -2.50 | 2.03 | -1.35 | -2.93 | -0.07 | 0.34 | -0.16 | -0.39 |
| EPS Diluted | -0.09 | -2.95 | 2.73 | 4.87 | -0.87 | 0.00 | -5.19 | -6.62 | -2.09 | -3.29 | -2.61 | -2.50 | 2.03 | -1.35 | -2.93 | -0.07 | 0.34 | -0.16 | -0.39 |
| Weighted Avg Shares Out | 34.23M | 34.23M | 35.13M | 35.10M | 34.43M | 34.43M | 81.30M | 53.29M | 53.17M | 52.90M | 52.60M | 52.45M | 52.14M | 46.69M | 38.05M | 38.05M | 81.85M | 81.85M | 81.85M |
| Weighted Avg Shares Out (Dil) | 34.23M | 34.23M | 35.13M | 35.10M | 34.43M | 34.43M | 81.30M | 53.29M | 53.17M | 52.90M | 52.60M | 52.45M | 52.15M | 46.69M | 38.05M | 38.05M | 81.85M | 81.85M | 81.85M |

Here Is Why Bargain Hunters Would Love Fast-paced Mover Verso (VRS)

Why Verso Popped 26.1% Today

Verso Stock (VRS): Why The Price Surged Today

New Strong Buy Stocks for November 17th

Surging Earnings Estimates Signal Upside for Verso (VRS) Stock

Verso Corp.: Investors Continue To Benefit From Shareholder Activism

Verso Corporation (VRS) CEO Randy Nebel on Q3 2021 Results - Earnings Call Transcript

Verso Corporation Provides Update on Discussions with Atlas Holdings

Verso Q2 Sales Beats Estimates, Declares Dividend

Verso (VRS) Q2 Earnings and Revenues Top Estimates
Source: https://incomestatements.info
Category: Stock Reports
