See more : Medicover AB (publ) (0RPS.L) Income Statement Analysis – Financial Results
Complete financial analysis of ATA Creativity Global (AACG) income statement, including revenue, profit margins, EPS and key performance metrics. Get detailed insights into the financial performance of ATA Creativity Global, a leading company in the Education & Training Services industry within the Consumer Defensive sector.
- Aurotek Corporation (6215.TW) Income Statement Analysis – Financial Results
- Questor Technology Inc. (QST.V) Income Statement Analysis – Financial Results
- Escorts Kubota Limited (ESCORTS.BO) Income Statement Analysis – Financial Results
- United Mining Industries Co. (9583.SR) Income Statement Analysis – Financial Results
- Shree Minerals Limited (SHH.AX) Income Statement Analysis – Financial Results
ATA Creativity Global (AACG)
About ATA Creativity Global
ATA Creativity Global, together with its subsidiaries, provides educational services to individual students through its training center network in China and internationally. Its educational services include portfolio training, research-based learning, overseas study counselling, in-school art classes through cooperation with high schools, foreign language training services, junior art education, and other related educational services to its students. The company also offers online courses for students. As of December 31, 2021, it operated through 21 training centers in 20 cities in China. The company was formerly known as ATA Inc. and changed its name to ATA Creativity Global in September 2019. ATA Creativity Global was founded in 1999 and is headquartered in Beijing, China.
| Metric | 2023 | 2022 | 2021 | 2020 | 2019 | 2018 | 2017 | 2016 | 2015 | 2014 | 2013 | 2012 | 2011 | 2010 | 2009 | 2008 | 2007 | 2006 | 2005 | 2004 | 2003 |
|---|---|---|---|---|---|---|---|---|---|---|---|---|---|---|---|---|---|---|---|---|---|
| Revenue | 221.62M | 206.82M | 202.21M | 162.17M | 97.77M | 1.34M | 7.49M | 472.39M | 417.14M | 350.16M | 384.67M | 366.68M | 352.09M | 303.90M | 245.03M | 217.55M | 172.12M | 84.88M | 68.99M | 21.39M | 22.62M |
| Cost of Revenue | 106.96M | 104.32M | 97.41M | 98.52M | 61.91M | 4.25M | 4.98M | 239.85M | 208.02M | 172.54M | 188.48M | 188.83M | 158.82M | 149.22M | 129.54M | 92.61M | 66.96M | 41.10M | 33.97M | 0.00 | 13.79M |
| Gross Profit | 114.66M | 102.51M | 104.80M | 63.65M | 35.86M | -2.91M | 2.51M | 232.53M | 209.12M | 177.62M | 196.19M | 177.84M | 193.27M | 154.69M | 115.50M | 124.94M | 105.16M | 43.78M | 35.03M | 21.39M | 8.83M |
| Gross Profit Ratio | 51.74% | 49.56% | 51.83% | 39.25% | 36.67% | -217.61% | 33.48% | 49.23% | 50.13% | 50.73% | 51.00% | 48.50% | 54.89% | 50.90% | 47.14% | 57.43% | 61.10% | 51.58% | 50.77% | 100.00% | 39.03% |
| Research & Development | 4.63M | 6.79M | 11.80M | 8.83M | 11.82M | 19.59M | 19.71M | 43.43M | 36.53M | 36.84M | 27.67M | 21.85M | 18.40M | 22.76M | 22.71M | 16.24M | 12.88M | 9.32M | 4.85M | 0.00 | 0.00 |
| General & Administrative | 72.82M | 77.05M | 93.26M | 100.10M | 81.92M | 43.51M | 36.56M | 68.78M | 78.21M | 65.61M | 67.87M | 79.59M | 64.03M | 56.66M | 83.89M | 57.39M | 5.71M | 32.02M | 0.00 | 0.00 | 0.00 |
| Selling & Marketing | 78.74M | 75.27M | 66.15M | 53.50M | 34.11M | 5.57M | 5.63M | 47.82M | 42.65M | 45.19M | 47.26M | 49.39M | 46.35M | 54.38M | 38.95M | 24.92M | 4.11M | 22.03M | 0.00 | 0.00 | 0.00 |
| SG&A | 151.55M | 152.32M | 159.41M | 153.60M | 116.04M | 49.08M | 42.19M | 116.60M | 120.86M | 110.79M | 115.13M | 128.98M | 110.38M | 111.04M | 122.84M | 82.31M | 68.84M | 54.05M | 31.27M | 0.00 | 0.00 |
| Other Expenses | -30.87K | -16.52K | -22.02K | 5.57M | 16.84M | -3.79M | 694.46M | 694.46K | -127.85K | -1.23M | 1.07M | 9.14M | 2.35M | 2.24M | 27.05M | 0.00 | 0.00 | 0.00 | 0.00 | 48.10M | -26.76M |
| Operating Expenses | 156.15M | 159.09M | 171.19M | 168.00M | 144.70M | 64.88M | 91.50M | 160.73M | 157.39M | 145.55M | 142.80M | 150.83M | 128.78M | 133.80M | 145.55M | 98.55M | 81.73M | 63.38M | 36.12M | 48.10M | -26.76M |
| Cost & Expenses | 263.11M | 263.41M | 268.60M | 266.53M | 206.61M | 69.13M | 96.49M | 400.58M | 365.41M | 318.09M | 331.28M | 339.66M | 287.60M | 283.01M | 275.09M | 191.16M | 148.69M | 104.48M | 70.08M | 48.10M | -12.97M |
| Interest Income | 0.00 | 0.00 | 0.00 | 0.00 | 0.00 | 0.00 | 970.27K | 3.99M | 3.57M | 4.14M | 4.77M | 3.12M | 2.06M | 1.04M | 731.18K | 395.11K | 473.83K | 599.87K | 331.68K | 0.00 | 0.00 |
| Interest Expense | 0.00 | 0.00 | 1.11B | 3.28B | 3.28B | 2.41M | 3.91B | 75.92K | 3.57M | 4.14M | 4.77M | 3.12M | 2.06M | 1.04M | 731.18K | 395.11K | 0.00 | 599.87K | 22.70M | 9.69M | 9.09M |
| Depreciation & Amortization | 21.98M | 22.59M | 23.03M | 29.91M | 17.55M | 13.33M | 12.24M | 10.29M | 8.61M | 7.58M | 10.75M | 10.62M | 11.28M | 13.64M | 12.75M | 5.21M | 2.70M | 1.84M | 24.24M | 1.07M | 152.00K |
| EBITDA | -19.51M | -34.00M | -43.36M | -74.44M | -91.29M | -55.00M | -47.16M | -46.51M | 60.35M | 39.65M | 65.21M | 37.63M | 75.76M | 34.53M | -17.30M | 31.59M | 26.13M | -16.75M | -1.03M | -2.51M | 22.62M |
| EBITDA Ratio | -8.80% | -28.00% | -46.35% | -59.62% | -74.80% | -4,864.32% | -629.27% | 12.63% | 12.76% | 9.55% | 17.01% | 7.35% | 17.28% | 6.50% | -12.15% | 13.30% | 13.10% | -20.44% | 35.39% | -11.73% | 100.00% |
| Operating Income | -41.50M | -56.59M | -66.39M | -104.36M | -108.84M | -67.79M | -59.40M | 71.81M | 51.73M | 31.76M | 41.38M | 27.01M | 64.49M | 20.89M | -30.06M | 26.39M | 23.43M | -19.60M | -1.09M | -3.58M | -17.93M |
| Operating Income Ratio | -18.72% | -27.36% | -32.83% | -64.35% | -111.32% | -5,064.42% | -792.61% | 15.20% | 12.40% | 9.07% | 10.76% | 7.37% | 18.32% | 6.87% | -12.27% | 12.13% | 13.61% | -23.09% | -1.58% | -16.73% | -79.28% |
| Total Other Income/Expenses | 973.65K | 2.07M | 28.44M | -3.38M | -23.49M | -261.52K | 28.69B | -1.42M | -6.76M | 872.56K | 4.72M | 3.20M | 5.69M | 2.17M | 447.31K | 3.06M | 4.06M | 1.01M | -24.20M | 0.00 | 3.58M |
| Income Before Tax | -40.52M | -54.52M | -37.95M | -110.85M | -141.26M | -68.06M | -88.02M | 28.63M | 44.97M | 32.63M | 47.17M | 30.21M | 70.18M | 23.07M | -29.61M | 29.45M | 27.50M | -18.58M | -25.28M | 0.00 | -26.87M |
| Income Before Tax Ratio | -18.28% | -26.36% | -18.77% | -68.36% | -144.48% | -5,084.55% | -1,174.63% | 6.06% | 10.78% | 9.32% | 12.26% | 8.24% | 19.93% | 7.59% | -12.08% | 13.54% | 15.98% | -21.89% | -36.64% | 0.00% | -118.81% |
| Income Tax Expense | -6.81M | -5.92M | -1.54M | -10.27M | -7.25M | -922.98M | 19.92M | 38.60M | 18.92M | 9.58M | 19.90M | 7.00M | 14.34M | 3.31M | 5.74M | 6.64M | 7.32M | -1.79M | -485.14K | 8.62M | 26.87M |
| Net Income | -33.66M | -48.59M | -36.41M | -100.58M | -134.01M | 854.92M | -114.00M | -9.72M | 26.05M | 23.06M | 27.28M | 23.21M | 55.84M | 19.75M | -35.35M | 22.81M | 20.17M | -16.79M | -24.79M | -12.20M | -26.87M |
| Net Income Ratio | -15.19% | -23.50% | -18.01% | -62.03% | -137.07% | 63,866.96% | -1,521.25% | -2.06% | 6.25% | 6.58% | 7.09% | 6.33% | 15.86% | 6.50% | -14.43% | 10.49% | 11.72% | -19.78% | -35.94% | -57.03% | -118.81% |
| EPS | -1.08 | -1.55 | -1.16 | -3.21 | -5.27 | 37.34 | -4.98 | -0.42 | 1.14 | 0.98 | 1.18 | 1.00 | 2.44 | 0.88 | -1.58 | 1.00 | 1.58 | -1.63 | -2.26 | -1.22 | -2.69 |
| EPS Diluted | -1.07 | -1.54 | -1.16 | -3.21 | -5.26 | 36.50 | -4.98 | -0.42 | 1.14 | 0.98 | 1.18 | 1.00 | 2.38 | 0.88 | -1.58 | 0.98 | 1.06 | -1.63 | -2.26 | -1.22 | -2.68 |
| Weighted Avg Shares Out | 31.17M | 31.38M | 31.37M | 31.33M | 25.41M | 22.90M | 22.91M | 23.13M | 22.80M | 22.80M | 22.61M | 22.48M | 22.36M | 22.23M | 22.39M | 22.69M | 12.72M | 10.30M | 10.95M | 10.00M | 10.00M |
| Weighted Avg Shares Out (Dil) | 31.39M | 31.51M | 31.37M | 31.33M | 25.46M | 23.42M | 22.91M | 23.13M | 22.80M | 22.80M | 22.62M | 22.56M | 22.83M | 22.23M | 22.39M | 23.22M | 19.03M | 10.30M | 10.95M | 10.00M | 10.03M |

NextGen Virtual Visits™ Keeps Virginia Cardiovascular Specialists Connected to Patients

ATA avisa que el PIB tardará en recuperarse y urge más medidas para autónomos

La Seguridad Social deja sin prestación a los autónomos en pluractividad

Archaeology bombshell: Strange discovery of mysterious 'Alien' figure

Solo uno de cada cuatro autónomos se irá de vacaciones este verano, según ATA

Safely Reopening Schools Doesn’t Mean Zero Risk

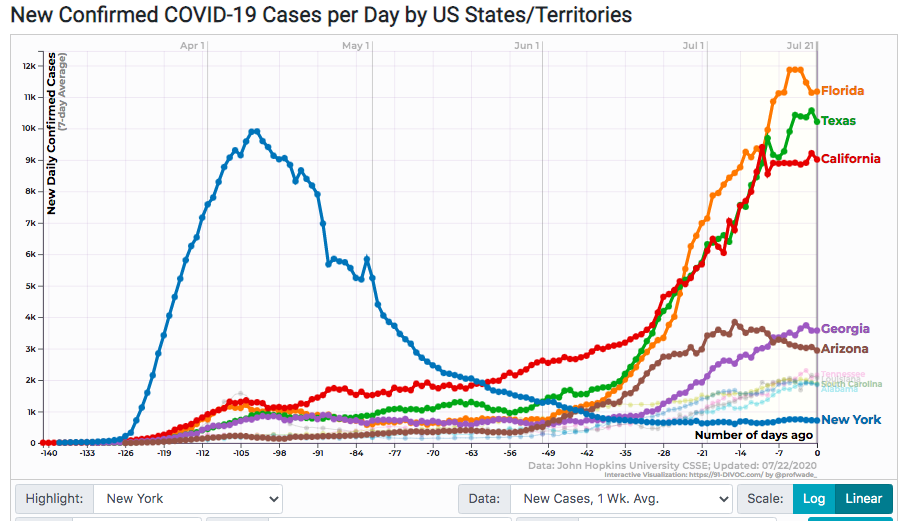
2:00PM Water Cooler 7/22/2020 | naked capitalism

Curso de formación y asesoramiento para emprendedores

Lorenzo Amor (ATA) reclama un «escudo de liquidez» para los autónomos a partir del otoño

Flexibilidad y liquidez para salvar empresas en Andalucía
Source: https://incomestatements.info
Category: Stock Reports
