See more : Model Performance Acquisition Corp. (MPACR) Income Statement Analysis – Financial Results
Complete financial analysis of ABB Ltd (ABB) income statement, including revenue, profit margins, EPS and key performance metrics. Get detailed insights into the financial performance of ABB Ltd, a leading company in the Electrical Equipment & Parts industry within the Industrials sector.
- PT Urban Jakarta Propertindo Tbk. (URBN.JK) Income Statement Analysis – Financial Results
- NewAmsterdam Pharma Company N.V. (NAMSW) Income Statement Analysis – Financial Results
- Toromont Industries Ltd. (TIH.TO) Income Statement Analysis – Financial Results
- Sampo Oyj (SAMPO-SDB.ST) Income Statement Analysis – Financial Results
- CyrusOne Inc. (CONE) Income Statement Analysis – Financial Results
ABB Ltd (ABB)
About ABB Ltd
ABB Ltd engages in manufacture and sale of electrification, automation, robotics, and motion products for customers in utilities, industry and transport, and infrastructure in Switzerland and internationally. Its Electrification segment provides electric vehicle charging infrastructure, renewable power solutions, modular substation packages, distribution automation products, switchboard and panelboards, switchgear, UPS solutions, circuit breakers, measuring and sensing devices, control products, wiring accessories, enclosures and cabling systems, and intelligent home and building solutions. The company's Robotics & Discrete Automation segment offers industrial robots, software, robotic solutions and systems, field services, spare parts, and digital services. This segment also offers solutions based on its programmable logic controllers, industrial PCs, servo motion, transport system, and machine vision. Its Motion segment manufactures and sells drives, motors, generators, traction converters, and mechanical power transmission products that are driving the low-carbon future for industries, cities, infrastructure, and transportation. The company's Process Automation segment provides process and discrete control technologies, advanced process control software and manufacturing execution systems, sensing, measurement and analytical instrumentation, marine propulsion systems, and large turbochargers. In addition, this segment offers remote monitoring, preventive maintenance, asset performance management, emission monitoring, and cybersecurity services. It serves aluminum, automotive, buildings and infrastructure, cement, channel partners, chemical, data centers, food and beverage, process automation, life sciences, marine and ports, metals, mining, oil and gas, ports, power generation, printing, pulp and paper, railway, smart cities, water, and wind power industries. The company was founded in 1883 and is headquartered in Zurich, Switzerland.
| Metric | 2022 | 2021 | 2020 | 2019 | 2018 | 2017 | 2016 | 2015 | 2014 | 2013 | 2012 | 2011 | 2010 | 2009 | 2008 | 2007 | 2006 | 2005 | 2004 | 2003 | 2002 | 2001 | 2000 | 1999 |
|---|---|---|---|---|---|---|---|---|---|---|---|---|---|---|---|---|---|---|---|---|---|---|---|---|
| Revenue | 29.45B | 28.95B | 26.13B | 27.98B | 27.66B | 34.31B | 33.83B | 35.48B | 39.83B | 41.85B | 39.34B | 37.99B | 31.59B | 31.80B | 34.91B | 29.18B | 24.41B | 22.44B | 20.72B | 18.80B | 18.30B | 23.73B | 22.97B | 24.36B |
| Cost of Revenue | 19.74B | 19.48B | 18.26B | 19.07B | 19.12B | 24.05B | 24.08B | 25.35B | 28.62B | 29.86B | 27.96B | 26.56B | 22.06B | 22.47B | 23.97B | 20.22B | 17.54B | 16.83B | 15.76B | 14.08B | 13.77B | 18.71B | 17.22B | 18.46B |
| Gross Profit | 9.71B | 9.47B | 7.88B | 8.91B | 8.54B | 10.27B | 9.75B | 10.13B | 11.22B | 11.99B | 11.38B | 11.43B | 9.53B | 9.33B | 10.94B | 8.97B | 6.87B | 5.61B | 4.96B | 4.72B | 4.53B | 5.02B | 5.75B | 5.90B |
| Gross Profit Ratio | 32.98% | 32.71% | 30.14% | 31.83% | 30.89% | 29.92% | 28.81% | 28.56% | 28.16% | 28.66% | 28.93% | 30.10% | 30.17% | 29.33% | 31.34% | 30.73% | 28.15% | 25.01% | 23.96% | 25.09% | 24.74% | 21.15% | 25.01% | 24.22% |
| Research & Development | 1.17B | 1.22B | 1.13B | 1.20B | 1.15B | 1.37B | 1.30B | 1.41B | 1.50B | 1.47B | 1.46B | 1.37B | 1.08B | 0.00 | 0.00 | 0.00 | 0.00 | 0.00 | 0.00 | 0.00 | 0.00 | 0.00 | 0.00 | 0.00 |
| General & Administrative | 1.88B | 1.88B | 1.81B | 2.06B | 2.07B | 2.02B | 1.87B | 1.85B | 2.01B | 2.02B | 1.89B | 0.00 | 0.00 | 0.00 | 0.00 | 0.00 | 0.00 | 0.00 | 0.00 | 0.00 | 0.00 | 0.00 | 0.00 | 0.00 |
| Selling & Marketing | 3.25B | 3.28B | 3.09B | 3.38B | 3.23B | 3.59B | 3.48B | 3.73B | 4.05B | 4.07B | 3.86B | 0.00 | 0.00 | 0.00 | 0.00 | 0.00 | 0.00 | 0.00 | 0.00 | 0.00 | 0.00 | 0.00 | 0.00 | 0.00 |
| SG&A | 5.13B | 5.16B | 4.90B | 5.45B | 5.30B | 5.61B | 5.35B | 5.57B | 6.07B | 6.09B | 5.76B | 5.37B | 4.62B | 5.53B | 5.82B | 4.98B | 4.43B | 3.92B | 3.79B | 3.83B | 4.03B | 4.40B | 4.42B | 4.68B |
| Other Expenses | 75.00M | -2.63B | -48.00M | 323.00M | -124.00M | 140.00M | -38.00M | 0.00 | 529.00M | -41.00M | -100.00M | 0.00 | 0.00 | 0.00 | 0.00 | 0.00 | 0.00 | 0.00 | 0.00 | 0.00 | 0.00 | 0.00 | 0.00 | 0.00 |
| Operating Expenses | 6.37B | 3.75B | 5.97B | 6.97B | 6.32B | 6.83B | 6.69B | 6.98B | 7.04B | 7.61B | 7.32B | 6.77B | 5.70B | 5.53B | 5.82B | 4.98B | 4.43B | 3.92B | 3.83B | 3.87B | 4.07B | 4.63B | 4.64B | 4.68B |
| Cost & Expenses | 26.11B | 23.23B | 24.23B | 26.04B | 25.44B | 30.88B | 30.77B | 32.33B | 35.65B | 37.46B | 35.28B | 33.32B | 27.76B | 28.00B | 29.79B | 25.19B | 21.98B | 20.75B | 19.59B | 17.95B | 17.84B | 23.34B | 21.86B | 23.14B |
| Interest Income | 72.00M | 51.00M | 51.00M | 67.00M | 72.00M | 74.00M | 73.00M | 77.00M | 80.00M | 69.00M | 73.00M | 90.00M | 95.00M | 121.00M | 0.00 | 0.00 | 0.00 | 0.00 | 0.00 | 0.00 | 0.00 | 0.00 | 0.00 | 0.00 |
| Interest Expense | 130.00M | 148.00M | 240.00M | 215.00M | 262.00M | 277.00M | 261.00M | 286.00M | 362.00M | 390.00M | 293.00M | 207.00M | 173.00M | 127.00M | 0.00 | 0.00 | 0.00 | 0.00 | 0.00 | 0.00 | 0.00 | 0.00 | 0.00 | 0.00 |
| Depreciation & Amortization | 1.00B | 1.11B | 876.00M | 1.10B | 1.07B | 1.10B | 1.14B | 1.16B | 1.31B | 1.32B | 1.18B | 995.00M | 702.00M | 655.00M | 661.00M | 602.00M | 570.00M | 597.00M | 633.00M | 585.00M | 611.00M | 787.00M | 836.00M | 795.00M |
| EBITDA | 4.34B | 6.83B | 2.47B | 3.04B | 3.30B | 4.61B | 4.27B | 4.38B | 5.56B | 5.77B | 5.31B | 5.75B | 4.63B | 4.57B | 6.35B | 4.57B | 2.86B | 2.24B | 1.82B | 1.62B | 1.12B | 1.28B | 1.67B | 1.92B |
| EBITDA Ratio | 14.73% | 23.59% | 9.45% | 10.86% | 11.92% | 13.43% | 12.62% | 12.34% | 13.97% | 13.80% | 13.51% | 15.14% | 14.65% | 14.38% | 18.17% | 15.64% | 11.71% | 9.96% | 8.76% | 8.61% | 6.13% | 5.39% | 7.27% | 7.87% |
| Operating Income | 3.34B | 5.72B | 1.59B | 1.94B | 2.23B | 3.43B | 3.06B | 3.05B | 4.18B | 4.39B | 4.13B | 4.76B | 3.93B | 3.92B | 5.68B | 3.96B | 2.29B | 1.64B | 1.18B | 1.03B | 510.00M | 491.00M | 833.00M | 1.12B |
| Operating Income Ratio | 11.33% | 19.75% | 6.10% | 6.93% | 8.05% | 10.01% | 9.05% | 8.59% | 10.49% | 10.48% | 10.50% | 12.52% | 12.43% | 12.32% | 16.28% | 13.58% | 9.37% | 7.30% | 5.70% | 5.50% | 2.79% | 2.07% | 3.63% | 4.61% |
| Total Other Income/Expenses | 57.00M | 69.00M | -752.00M | -76.00M | -107.00M | -203.00M | -188.00M | -209.00M | -282.00M | -321.00M | -293.00M | -207.00M | -187.00M | 202.00M | -1.17B | 47.00M | 145.00M | -142.00M | -321.00M | -870.00M | -272.00M | -410.00M | 425.00M | -101.00M |
| Income Before Tax | 3.39B | 5.79B | 841.00M | 1.86B | 2.12B | 3.23B | 2.87B | 2.84B | 3.90B | 4.07B | 3.84B | 4.55B | 3.74B | 4.12B | 4.52B | 4.01B | 2.43B | 1.50B | 861.00M | 164.00M | 180.00M | -25.00M | 1.26B | 1.02B |
| Income Before Tax Ratio | 11.53% | 19.99% | 3.22% | 6.66% | 7.66% | 9.42% | 8.49% | 8.00% | 9.78% | 9.72% | 9.76% | 11.98% | 11.84% | 12.96% | 12.94% | 13.74% | 9.97% | 6.67% | 4.16% | 0.87% | 0.98% | -0.11% | 5.48% | 4.20% |
| Income Tax Expense | 757.00M | 1.06B | 496.00M | 772.00M | 544.00M | 860.00M | 790.00M | 788.00M | 1.20B | 1.12B | 1.03B | 1.24B | 1.02B | 1.00B | 1.12B | 595.00M | 697.00M | 482.00M | 311.00M | 78.00M | 83.00M | 105.00M | 377.00M | 343.00M |
| Net Income | 2.48B | 4.55B | 345.00M | 1.09B | 1.58B | 2.21B | 1.96B | 1.93B | 2.59B | 2.79B | 2.70B | 3.17B | 2.56B | 2.90B | 3.12B | 3.76B | 1.39B | 735.00M | -35.00M | -767.00M | -783.00M | -691.00M | 1.44B | 1.36B |
| Net Income Ratio | 8.41% | 15.71% | 1.32% | 3.90% | 5.69% | 6.45% | 5.80% | 5.45% | 6.51% | 6.66% | 6.87% | 8.34% | 8.11% | 9.12% | 8.93% | 12.87% | 5.69% | 3.28% | -0.17% | -4.08% | -4.28% | -2.91% | 6.28% | 5.58% |
| EPS | 1.30 | 2.27 | 0.16 | 0.51 | 0.74 | 1.04 | 0.91 | 0.87 | 1.13 | 1.21 | 1.18 | 1.38 | 1.12 | 1.27 | 1.36 | 1.66 | 0.65 | 0.36 | -0.02 | -0.65 | -0.71 | -0.63 | 1.21 | 0.29 |
| EPS Diluted | 1.30 | 2.25 | 0.16 | 0.51 | 0.74 | 1.03 | 0.91 | 0.87 | 1.13 | 1.21 | 1.18 | 1.38 | 1.12 | 1.27 | 1.36 | 1.63 | 0.63 | 0.36 | -0.02 | -0.65 | -0.71 | -0.63 | 1.20 | 0.29 |
| Weighted Avg Shares Out | 1.90B | 2.00B | 2.11B | 2.13B | 2.13B | 2.14B | 2.15B | 2.23B | 2.29B | 2.30B | 2.29B | 2.29B | 2.29B | 2.28B | 2.29B | 2.26B | 2.14B | 2.04B | 1.75B | 1.17B | 1.11B | 1.10B | 1.19B | 4.74B |
| Weighted Avg Shares Out (Dil) | 1.91B | 2.02B | 2.12B | 2.14B | 2.14B | 2.15B | 2.15B | 2.23B | 2.30B | 2.31B | 2.30B | 2.29B | 2.29B | 2.29B | 2.30B | 2.30B | 2.21B | 2.04B | 1.75B | 1.17B | 1.11B | 1.10B | 1.20B | 4.75B |

BrainBox AI Announces US$20 Million Investment from Québec Government and ABB; and Enters into Agreement to Acquire ABB Multi-Site Retail Business

ABB Q1 Earnings Surpass Estimates, Revenues Rise 13% Y/Y
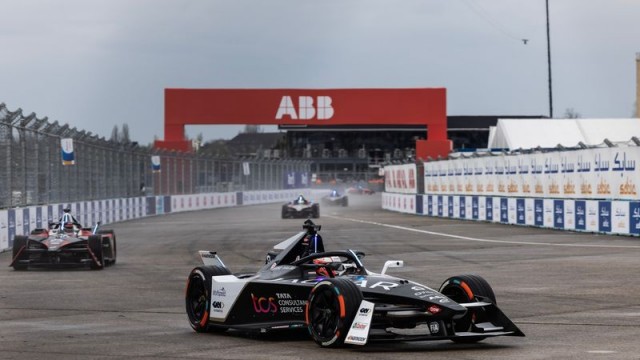
ABB posts 72% rise in net profit, lifts guidance
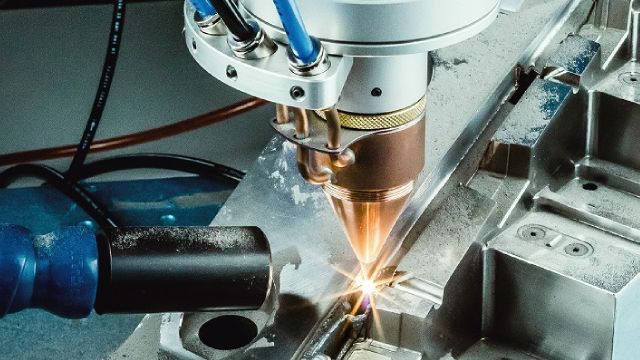
3 Manufacturing Electronics Stocks to Gain From Improving Supply Chains
Here's Why You Should Retain ABB in Your Portfolio for Now
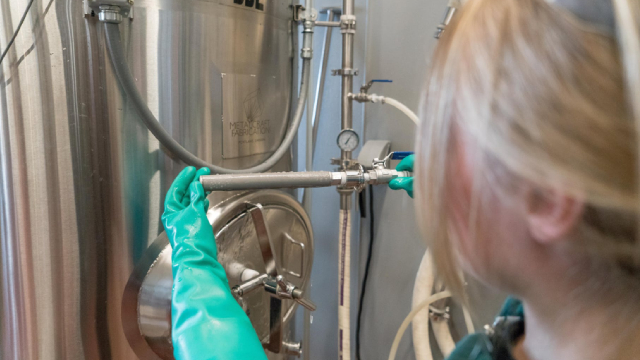
ABB to Invest $170M in Manufacturing Facilities Across the US

ABB invests $170 million in the U.S.

3 EV Pick-and-Shovel Plays for a Clean Energy Future
ABB Invests $40M for Manufacturing Facility in Albuquerque

The 7 Best Robotics Stocks to Buy for Long-Term Growth
Source: https://incomestatements.info
Category: Stock Reports
