See more : Wienerberger AG (WIB.DE) Income Statement Analysis – Financial Results
Complete financial analysis of Accelleron Industries AG (ACLLY) income statement, including revenue, profit margins, EPS and key performance metrics. Get detailed insights into the financial performance of Accelleron Industries AG, a leading company in the Aerospace & Defense industry within the Industrials sector.
- ABB Ltd (0NX2.L) Income Statement Analysis – Financial Results
- Jiangsu Changshu Rural Commercial Bank Co., Ltd. (601128.SS) Income Statement Analysis – Financial Results
- East Resources Acquisition Company (ERESU) Income Statement Analysis – Financial Results
- Axon Enterprise, Inc. (AXON) Income Statement Analysis – Financial Results
- Japan Tobacco Inc. (2914.T) Income Statement Analysis – Financial Results
Accelleron Industries AG (ACLLY)
About Accelleron Industries AG
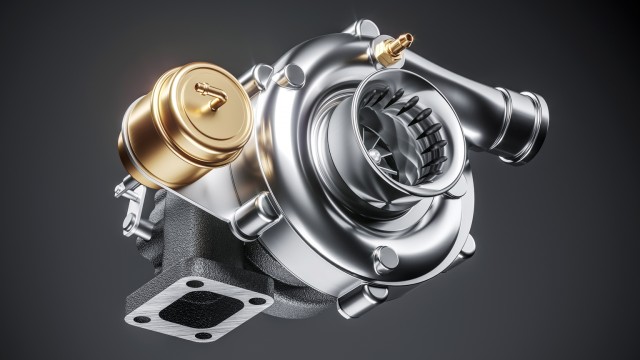
Accelleron Industries AG designs, manufactures, sells, and services customized turbochargers and digital solutions worldwide. Its products are used in marine, energy, and rail/off-highway industries worldwide. The company is headquartered in Baden, Switzerland.
| Metric | 2023 | 2022 | 2021 | 2020 | 2019 |
|---|---|---|---|---|---|
| Revenue | 914.86M | 780.54M | 756.47M | 711.00M | 783.00M |
| Cost of Revenue | 528.93M | 427.71M | 400.82M | 406.00M | 411.00M |
| Gross Profit | 385.93M | 352.82M | 355.65M | 305.00M | 372.00M |
| Gross Profit Ratio | 42.18% | 45.20% | 47.01% | 42.90% | 47.51% |
| Research & Development | 57.45M | 51.09M | 51.63M | 48.00M | 46.00M |
| General & Administrative | 192.47M | 149.60M | 121.04M | 0.00 | 0.00 |
| Selling & Marketing | 0.00 | 0.00 | 0.00 | 0.00 | 0.00 |
| SG&A | 192.47M | 149.60M | 121.04M | 119.00M | 126.00M |
| Other Expenses | -5.29M | 0.00 | 0.00 | 0.00 | 0.00 |
| Operating Expenses | 244.63M | 195.79M | 170.07M | 169.00M | 171.00M |
| Cost & Expenses | 773.55M | 623.50M | 570.89M | 575.00M | 582.00M |
| Interest Income | 0.00 | 0.00 | 0.00 | 1.00M | 0.00 |
| Interest Expense | 4.13M | 555.00K | 1.38M | 0.00 | 0.00 |
| Depreciation & Amortization | 30.13M | 22.79M | 23.50M | 24.00M | 21.00M |
| EBITDA | 172.05M | 179.78M | 209.09M | 161.00M | 222.00M |
| EBITDA Ratio | 18.81% | 23.03% | 27.64% | 22.64% | 28.35% |
| Operating Income | 141.31M | 157.04M | 185.58M | 137.00M | 201.00M |
| Operating Income Ratio | 15.45% | 20.12% | 24.53% | 19.27% | 25.67% |
| Total Other Income/Expenses | -4.13M | -555.00K | -1.38M | 0.00 | 0.00 |
| Income Before Tax | 137.18M | 156.48M | 184.20M | 137.00M | 201.00M |
| Income Before Tax Ratio | 14.99% | 20.05% | 24.35% | 19.27% | 25.67% |
| Income Tax Expense | 27.21M | 26.69M | 39.90M | 25.00M | 42.00M |
| Net Income | 101.21M | 122.80M | 138.51M | 107.00M | 155.00M |
| Net Income Ratio | 11.06% | 15.73% | 18.31% | 15.05% | 19.80% |
| EPS | 1.08 | 1.31 | 1.48 | 0.00 | 0.00 |
| EPS Diluted | 1.08 | 1.31 | 1.48 | 0.00 | 0.00 |
| Weighted Avg Shares Out | 93.76M | 93.75M | 93.75M | 0.00 | 0.00 |
| Weighted Avg Shares Out (Dil) | 93.85M | 93.75M | 93.75M | 0.00 | 0.00 |

Accelleron Industries AG (ACLLY) Q2 2024 Earnings Call Transcript

Accelleron Industries AG (ACLLY) Q4 2023 Earnings Call Transcript

Accelleron: This ABB Spinoff Looks Like A Solid Slow Grower With Decent Income Potential
Source: https://incomestatements.info
Category: Stock Reports
