See more : Runner (Xiamen) Corp. (603408.SS) Income Statement Analysis – Financial Results
Complete financial analysis of Acciona, S.A. (ACXIF) income statement, including revenue, profit margins, EPS and key performance metrics. Get detailed insights into the financial performance of Acciona, S.A., a leading company in the Engineering & Construction industry within the Industrials sector.
- Sandmartin International Holdings Limited (0482.HK) Income Statement Analysis – Financial Results
- Dongguan Chitwing Technology Co., Ltd. (002855.SZ) Income Statement Analysis – Financial Results
- Doseology Sciences Inc. (MOOD.CN) Income Statement Analysis – Financial Results
- Nichia Steel Works, Ltd. (5658.T) Income Statement Analysis – Financial Results
- GMO Payment Gateway, Inc. (3769.T) Income Statement Analysis – Financial Results
Acciona, S.A. (ACXIF)
About Acciona, S.A.
Acciona, S.A., together with its subsidiaries, engages in the energy, infrastructure, and other businesses in Spain and internationally. The company develops, constructs, operates, and maintains wind, solar photovoltaic, solar thermal, hydro, and biomass plants. It also engages in designing, construction, maintenance, and management of infrastructure projects, including bridges, highways, motorways, roads, tunnels, railway, and metros and trams, as well as ports and water channels, airports, freight forwarding, data centers, substations, and transmission lines. In addition, the company offers event planning and management services, as well as designs, constructs, and operates drinking water treatment plants, reverse osmosis desalination plants, wastewater treatment plants, and tertiary treatment plants for water reuse; and constructs, operates, and manages healthcare, universities and campuses, ecosystems restoration, museums and exhibitions, and event planning and management; Further, it provides hotels and holiday resorts, offices, and industrial properties; financial solutions; facility management and airport handling; and museum interior design. It also engages in the fund management, stock broking, real estate, motorbike sharing, and other businesses. Acciona, S.A. was founded in 1916 and is headquartered in Alcobendas, Spain.
| Metric | 2023 | 2022 | 2021 | 2020 | 2019 | 2018 | 2017 | 2016 | 2015 | 2014 | 2013 | 2012 | 2011 | 2010 | 2009 | 2008 | 2007 | 2006 | 2005 | 2004 | 2003 | 2002 | 2001 | 2000 | 1999 |
|---|---|---|---|---|---|---|---|---|---|---|---|---|---|---|---|---|---|---|---|---|---|---|---|---|---|
| Revenue | 17.97B | 11.20B | 8.10B | 6.47B | 7.19B | 7.51B | 7.25B | 5.98B | 6.54B | 6.50B | 6.61B | 7.02B | 6.65B | 6.26B | 6.51B | 12.91B | 7.95B | 6.27B | 4.85B | 4.08B | 3.86B | 3.41B | 503.47B | 478.03M | 425.53M |
| Cost of Revenue | 5.47B | 3.41B | 1.87B | 2.02B | 2.00B | 2.13B | 1.95B | 1.59B | 1.83B | 1.86B | 1.53B | 1.66B | 1.71B | 1.66B | 2.10B | 5.89B | 2.83B | 1.63B | 1.29B | 1.12B | 2.49B | 2.33B | 0.00 | 0.00 | 0.00 |
| Gross Profit | 12.50B | 7.78B | 6.23B | 4.45B | 5.19B | 5.38B | 5.31B | 4.39B | 4.71B | 4.64B | 5.08B | 5.35B | 4.94B | 4.60B | 4.42B | 7.01B | 5.13B | 4.64B | 3.56B | 2.96B | 1.37B | 1.09B | 503.47B | 478.03M | 425.53M |
| Gross Profit Ratio | 69.58% | 69.53% | 76.92% | 68.75% | 72.12% | 71.68% | 73.17% | 73.46% | 71.99% | 71.36% | 76.88% | 76.29% | 74.27% | 73.45% | 67.82% | 54.35% | 64.45% | 74.00% | 73.32% | 72.57% | 35.53% | 31.83% | 100.00% | 100.00% | 100.00% |
| Research & Development | 0.00 | 0.00 | 0.00 | 0.00 | 0.00 | 0.00 | 0.00 | 0.00 | 0.00 | 0.00 | 0.00 | 0.00 | 0.00 | 0.00 | 0.00 | 0.00 | 0.00 | 0.00 | 0.00 | 0.00 | 0.00 | 0.00 | 0.00 | 0.00 | 0.00 |
| General & Administrative | 7.50B | 4.65B | 3.52B | 2.51B | 2.76B | 2.92B | 2.93B | 2.25B | 2.32B | 2.40B | 2.59B | 2.92B | 2.94B | 0.00 | 0.00 | 0.00 | 0.00 | 3.11M | 2.74M | 0.00 | 661.68M | 547.73M | 151.77B | 147.76M | 120.05M |
| Selling & Marketing | -4.34B | 0.00 | 0.00 | 0.00 | 0.00 | 0.00 | 0.00 | 0.00 | 0.00 | 0.00 | 0.00 | 0.00 | 0.00 | 0.00 | 0.00 | 0.00 | 0.00 | 0.00 | 0.00 | 0.00 | 0.00 | 0.00 | 0.00 | 0.00 | 0.00 |
| SG&A | 3.16B | 4.65B | 3.52B | 2.51B | 2.76B | 2.92B | 2.93B | 2.25B | 2.32B | 2.40B | 2.59B | 2.92B | 2.94B | 0.00 | 0.00 | 0.00 | 0.00 | 3.11M | 2.74M | 0.00 | 661.68M | 547.73M | 151.77B | 147.76M | 120.05M |
| Other Expenses | 8.09B | -257.00M | -204.20M | -241.34M | -9.60M | -129.00K | 3.77M | 42.84M | 27.39M | -326.00K | -5.63M | 2.48M | 3.40M | 49.31M | 3.84M | -20.91M | 450.57M | -15.51M | -14.08M | -14.85M | 2.26B | -149.86M | -21.75B | -175.40M | 0.00 |
| Operating Expenses | 11.25B | 6.62B | 5.57B | 4.09B | 4.49B | 4.78B | 4.70B | 3.98B | 4.10B | 4.10B | 5.01B | 4.65B | 4.30B | 4.08B | 3.97B | 5.34B | 4.41B | 4.01B | 3.05B | 2.60B | 43.17M | 898.21M | 475.35B | 448.82M | 403.36M |
| Cost & Expenses | 16.72B | 10.04B | 7.44B | 6.12B | 6.49B | 6.90B | 6.64B | 5.57B | 5.93B | 5.96B | 6.53B | 6.31B | 6.01B | 5.74B | 6.06B | 11.23B | 7.23B | 5.64B | 4.34B | 3.72B | 2.53B | 3.23B | 475.35B | 448.82M | 403.36M |
| Interest Income | 168.00M | 46.00M | 52.30M | 30.99M | 28.08M | 44.25M | 41.06M | 52.64M | 31.03M | 44.74M | 70.16M | 68.72M | 52.18M | 82.65M | 119.54M | 336.28M | 671.51M | 119.63M | 0.00 | 0.00 | 80.30M | 77.10M | 11.87B | 8.60M | 4.02M |
| Interest Expense | 511.00M | 257.00M | 234.74M | 256.26M | 265.21M | 341.63M | 367.00M | 731.89M | 422.20M | 417.16M | 472.91M | 515.91M | 466.75M | 415.77M | 335.46M | 1.28B | 722.84M | 257.53M | 0.00 | 0.00 | -18.05M | -33.72M | -3.70B | -1.88M | -1.18M |
| Depreciation & Amortization | 1.09B | 651.00M | 586.58M | 556.68M | 585.70M | 609.52M | 633.16M | 547.15M | 586.92M | 526.91M | 3.01B | 785.80M | 974.65M | 715.68M | 668.29M | 1.32B | 475.67M | 328.02M | 226.06M | 215.86M | 9.39M | 4.84M | 424.00M | 693.00M | 177.00M |
| EBITDA | 2.42B | 1.97B | 1.46B | 1.13B | 1.44B | 1.34B | 1.36B | 1.51B | 1.33B | 1.22B | 1.17B | 1.55B | 1.61B | 1.24B | 1.14B | 1.13B | 2.32B | 1.01B | 734.45M | 557.49M | 1.34B | 193.59M | 28.54B | 722.21M | 199.17M |
| EBITDA Ratio | 13.49% | 18.12% | 18.03% | 17.39% | 19.82% | 17.83% | 16.73% | 25.22% | 20.49% | 17.92% | 33.35% | 22.76% | 24.17% | 21.82% | 17.57% | 25.91% | 29.14% | 16.10% | 15.13% | 13.70% | 34.65% | 5.67% | 5.67% | 151.08% | 46.81% |
| Operating Income | 1.25B | 1.33B | 829.50M | 616.44M | 698.88M | 757.41M | 720.33M | 988.18M | 626.92M | 571.96M | -1.77B | 646.20M | 631.69M | 526.56M | 448.22M | 1.68B | 719.81M | 630.22M | 511.95M | 355.52M | 1.33B | 188.75M | 28.12B | 29.21M | 22.17M |
| Operating Income Ratio | 6.96% | 11.92% | 10.24% | 9.52% | 9.72% | 10.09% | 9.93% | 16.53% | 9.58% | 8.80% | -26.80% | 9.21% | 9.50% | 8.41% | 6.88% | 13.00% | 9.05% | 10.05% | 10.55% | 8.72% | 34.41% | 5.53% | 5.59% | 6.11% | 5.21% |
| Total Other Income/Expenses | -432.00M | -465.00M | -254.00M | -108.37M | -237.10M | -248.63M | -4.07B | -580.54M | -308.34M | -294.87M | -342.24M | -400.79M | -407.82M | -286.37M | -227.47M | -204.14M | 229.55M | 1.13B | -19.02M | -13.90M | 1.05B | 30.72M | 1.97B | -2.92M | -540.00K |
| Income Before Tax | 819.00M | 869.00M | 574.75M | 508.07M | 544.77M | 508.78M | 356.29M | 407.64M | 318.58M | 277.10M | -2.17B | 245.51M | 223.87M | 240.19M | 214.82M | 745.65M | 1.12B | 1.76B | 492.93M | 341.62M | 2.38B | 219.48M | 30.09B | 26.29M | 21.63M |
| Income Before Tax Ratio | 4.56% | 7.76% | 7.09% | 7.85% | 7.58% | 6.78% | 4.91% | 6.82% | 4.87% | 4.26% | -32.91% | 3.50% | 3.37% | 3.84% | 3.30% | 5.78% | 14.07% | 28.01% | 10.16% | 8.38% | 61.63% | 6.43% | 5.98% | 5.50% | 5.08% |
| Income Tax Expense | 198.00M | 254.00M | 170.61M | 97.39M | 147.27M | 136.32M | 105.34M | 33.78M | 82.82M | 69.91M | -145.78M | 61.33M | 53.45M | 55.98M | 44.06M | 178.32M | 123.45M | 368.29M | 150.09M | 87.55M | -417.84M | -51.26M | -6.93B | -5.95M | -5.21M |
| Net Income | 541.00M | 441.00M | 332.00M | 387.05M | 351.68M | 328.03M | 220.13M | 351.98M | 207.32M | 184.95M | -1.97B | 189.40M | 202.06M | 167.22M | 1.27B | 655.12M | 950.42M | 1.37B | 324.38M | 230.31M | 1.96B | 168.22M | 23.16B | 20.35M | 16.42M |
| Net Income Ratio | 3.01% | 3.94% | 4.10% | 5.98% | 4.89% | 4.37% | 3.03% | 5.89% | 3.17% | 2.85% | -29.85% | 2.70% | 3.04% | 2.67% | 19.48% | 5.08% | 11.95% | 21.84% | 6.68% | 5.65% | 50.82% | 4.93% | 4.60% | 4.26% | 3.86% |
| EPS | 9.89 | 8.06 | 6.08 | 7.10 | 6.46 | 5.90 | 3.85 | 6.17 | 3.65 | 3.24 | -34.55 | 3.30 | 3.40 | 2.73 | 20.44 | 10.56 | 15.31 | 21.84 | 5.13 | 3.55 | 30.65 | 2.51 | 2.16 | 300.00 | 241.00 |
| EPS Diluted | 9.89 | 8.06 | 6.08 | 7.10 | 6.46 | 5.90 | 3.79 | 6.17 | 3.65 | 3.24 | -34.55 | 3.30 | 3.40 | 2.73 | 20.44 | 10.56 | 15.31 | 21.84 | 5.13 | 3.55 | 30.65 | 2.51 | 2.16 | 300.00 | 241.00 |
| Weighted Avg Shares Out | 54.72M | 54.68M | 54.63M | 54.52M | 54.44M | 55.59M | 57.12M | 57.01M | 56.79M | 57.05M | 57.09M | 57.33M | 59.45M | 61.22M | 62.04M | 62.06M | 62.10M | 62.75M | 63.28M | 64.88M | 64.09M | 67.02M | 10.72B | 67.82K | 68.15K |
| Weighted Avg Shares Out (Dil) | 54.72M | 54.68M | 54.63M | 54.52M | 54.44M | 55.59M | 59.45M | 58.85M | 62.22M | 61.42M | 57.10M | 57.33M | 59.45M | 61.22M | 62.04M | 62.06M | 62.10M | 62.75M | 63.28M | 64.88M | 64.09M | 67.02M | 10.72B | 67.82K | 68.15K |

Acciona Energia considers sale of $1.1 billion hydro portfolio, sources say

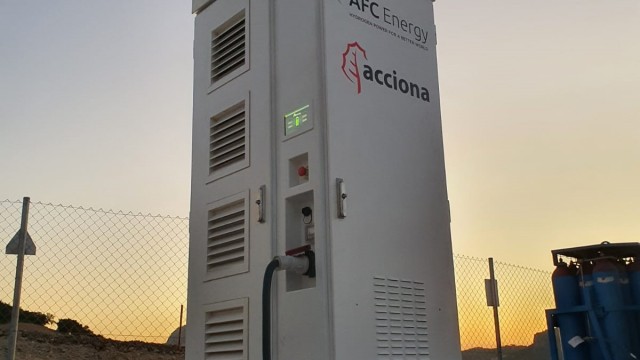
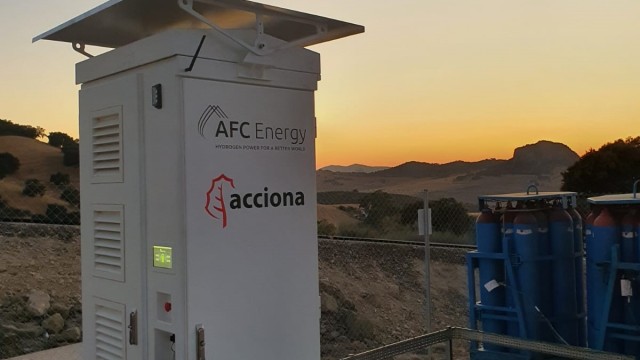
AFC Energy ships hydrogen power generator to ACCIONA

Acciona, S.A. (ACXIF) Q2 2024 Earnings Call Transcript

Spain's Acciona launches swappable battery electric vehicle

Exclusive: Spain's Acciona downsizing renewable energy business in Brazil, sources say

Acciona, S.A. (ACXIF) Q4 2023 Earnings Call Transcript

Acciona, S.A. (ACXIF) Q2 2023 Earnings Call Transcript

Acciona's first-half profit edges up despite revenue drop

AFC Energy hefty target price reiterated after ACCIONA order

AFC Energy receives first order from ACCIONA for hydrogen power unit
Source: https://incomestatements.info
Category: Stock Reports
