See more : Tintra PLC (TNTAF) Income Statement Analysis – Financial Results
Complete financial analysis of Armstrong Flooring, Inc. (AFI) income statement, including revenue, profit margins, EPS and key performance metrics. Get detailed insights into the financial performance of Armstrong Flooring, Inc., a leading company in the Construction industry within the Industrials sector.
- Evolution Mining Limited (CAHPF) Income Statement Analysis – Financial Results
- Prospector Metals Corp. (PPP.V) Income Statement Analysis – Financial Results
- Wiscom Co.,Ltd. (024070.KS) Income Statement Analysis – Financial Results
- Montague International Holding Ltd. (MIHL) Income Statement Analysis – Financial Results
- Michang Oil Ind .Co.,Ltd. (003650.KS) Income Statement Analysis – Financial Results
Armstrong Flooring, Inc. (AFI)
About Armstrong Flooring, Inc.
Armstrong Flooring, Inc., together with its subsidiaries, designs, manufactures, sources, and sells flooring products in North America and the Pacific Rim. It offers resilient flooring products. The company's products are used in the construction and renovation of commercial, residential, and institutional buildings. It sells its products to independent wholesale flooring distributors, other retailers, end-use customers, and contractors, as well as direct to specialty retailers. The company was founded in 1860 and is headquartered in Lancaster, Pennsylvania. On May 8, 2022, Armstrong Flooring, Inc., along with its affiliates, filed a voluntary petition for reorganization under Chapter 11 in the U.S. Bankruptcy Court for the District of Delaware.
| Metric | 2021 | 2020 | 2019 | 2018 | 2017 | 2016 | 2015 | 2014 | 2013 | 2012 |
|---|---|---|---|---|---|---|---|---|---|---|
| Revenue | 649.00M | 584.80M | 626.30M | 728.20M | 1.13B | 1.19B | 1.19B | 1.22B | 1.26B | 1.21B |
| Cost of Revenue | 575.00M | 501.30M | 541.00M | 585.00M | 963.60M | 963.10M | 961.10M | 1.02B | 1.05B | 958.70M |
| Gross Profit | 74.00M | 83.50M | 85.30M | 143.20M | 170.10M | 230.10M | 227.60M | 198.70M | 208.80M | 251.10M |
| Gross Profit Ratio | 11.40% | 14.28% | 13.62% | 19.66% | 15.00% | 19.28% | 19.15% | 16.28% | 16.53% | 20.76% |
| Research & Development | 0.00 | 0.00 | 0.00 | 0.00 | 0.00 | 0.00 | 0.00 | 0.00 | 0.00 | 0.00 |
| General & Administrative | 0.00 | 145.20M | 146.40M | 160.60M | 204.60M | 211.20M | 209.70M | 177.10M | 168.20M | 167.50M |
| Selling & Marketing | 0.00 | 0.00 | 0.00 | 0.00 | 0.00 | 0.00 | 0.00 | 0.00 | 0.00 | 0.00 |
| SG&A | 160.00M | 145.20M | 146.40M | 160.60M | 204.60M | 211.20M | 209.70M | 177.10M | 168.20M | 167.50M |
| Other Expenses | 0.00 | 0.00 | 0.00 | 0.00 | 0.00 | 0.00 | 0.00 | 0.00 | 0.00 | 0.00 |
| Operating Expenses | 160.00M | 145.20M | 146.40M | 160.60M | 204.60M | 211.20M | 209.70M | 177.10M | 168.20M | 167.50M |
| Cost & Expenses | 735.00M | 646.50M | 687.40M | 745.60M | 1.17B | 1.17B | 1.17B | 1.20B | 1.22B | 1.13B |
| Interest Income | 0.00 | 0.00 | 0.00 | 0.00 | 0.00 | 0.00 | 0.00 | 0.00 | 0.00 | 0.00 |
| Interest Expense | 12.00M | 7.50M | 4.40M | 4.80M | 2.80M | 1.50M | 0.00 | 0.00 | 0.00 | 0.00 |
| Depreciation & Amortization | -200.00K | 47.80M | 50.70M | 55.10M | 78.70M | 46.60M | 38.10M | 52.10M | 43.70M | 41.60M |
| EBITDA | -41.00M | -9.10M | -1.80M | -109.10M | 31.50M | 61.40M | 92.30M | 18.50M | 49.00M | 96.70M |
| EBITDA Ratio | -6.32% | -1.56% | -0.29% | -14.98% | 2.78% | 5.15% | 7.76% | 1.52% | 3.88% | 7.99% |
| Operating Income | -40.80M | -61.70M | -61.10M | -17.40M | -47.00M | 18.90M | 17.90M | 10.80M | 40.60M | 83.60M |
| Operating Income Ratio | -6.29% | -10.55% | -9.76% | -2.39% | -4.15% | 1.58% | 1.51% | 0.88% | 3.22% | 6.91% |
| Total Other Income/Expenses | -12.20M | -2.70M | -6.20M | -7.70M | -3.00M | -7.30M | -3.60M | -4.40M | 400.00K | -100.00K |
| Income Before Tax | -53.00M | -64.40M | -67.30M | -25.10M | -50.00M | 11.60M | 14.30M | 6.40M | 41.00M | 83.50M |
| Income Before Tax Ratio | -8.17% | -11.01% | -10.75% | -3.45% | -4.41% | 0.97% | 1.20% | 0.52% | 3.25% | 6.90% |
| Income Tax Expense | 200.00K | -800.00K | 1.60M | -6.00M | -8.20M | 4.10M | 5.30M | 3.60M | 14.10M | 31.60M |
| Net Income | -53.20M | -63.60M | -58.50M | -163.00M | -41.80M | 9.20M | 48.90M | -37.20M | -8.80M | 23.50M |
| Net Income Ratio | -8.20% | -10.88% | -9.34% | -22.38% | -3.69% | 0.77% | 4.11% | -3.05% | -0.70% | 1.94% |
| EPS | -2.43 | -2.90 | -2.43 | -6.27 | -1.54 | 0.33 | 1.76 | -1.34 | -0.32 | 0.85 |
| EPS Diluted | -2.43 | -2.90 | -2.43 | -6.27 | -1.54 | 0.33 | 1.76 | -1.34 | -0.32 | 0.85 |
| Weighted Avg Shares Out | 21.93M | 21.93M | 24.10M | 26.00M | 27.10M | 27.90M | 27.74M | 27.74M | 27.74M | 27.74M |
| Weighted Avg Shares Out (Dil) | 21.93M | 21.93M | 24.10M | 26.00M | 27.10M | 28.10M | 27.74M | 27.74M | 27.74M | 27.74M |

QAnon conspiracy theory is on the ballot in some states this November

US Open: Rublev, Thiem and Williams into quarter-finals – as it happened
Tracking ValueAct Portfolio - Q2 2020 Update

Armstrong World Industries Inc (NYSE:AWI) Shares Purchased by HighTower Advisors LLC

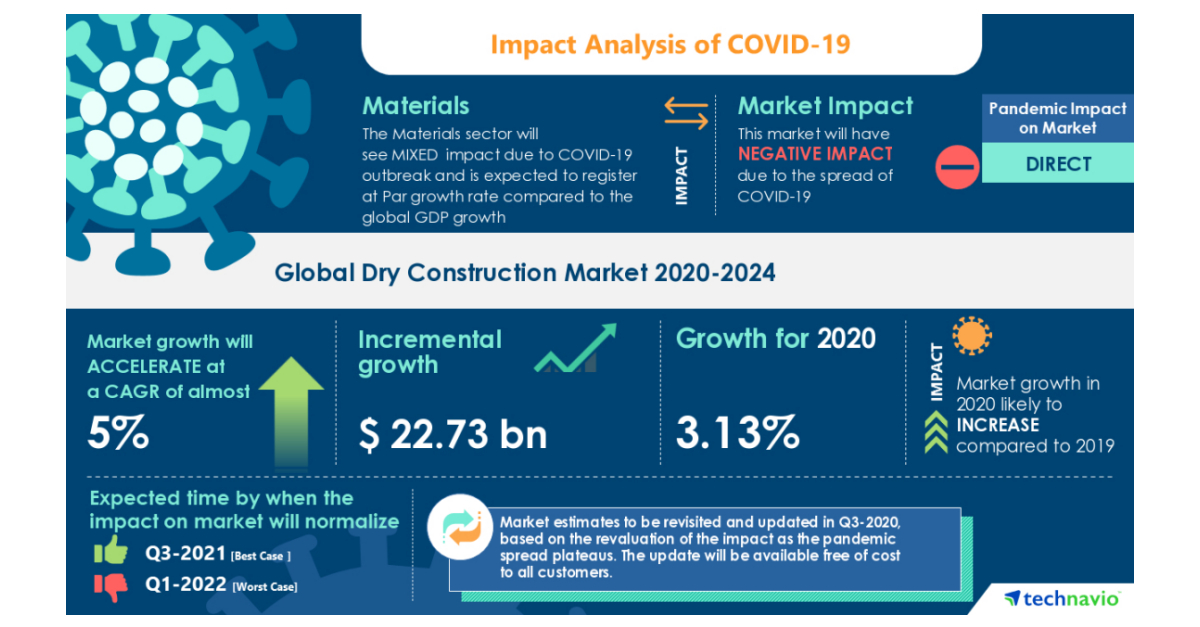
COVID-19 Impacts: Global Dry Construction Market will Accelerate at a CAGR of almost 5% through 2020-2024 | Rise In Construction Activities to Boost Growth | Technavio

Hologic to Acquire Acessa Health, Innovator in Minimally Invasive Solutions for Treatment of Fibroids

9. Els lligams entre empreses sureres empordaneses i els serveis d'intel·ligència nazis

Newcastle West End: Elswick to Newburn

Hey Duggee: how a cult CBeebies show became the most surprising TV smash hit of lockdown

Armstrong Flooring to Address Attendees at the Jefferies Virtual Industrials Conference
Source: https://incomestatements.info
Category: Stock Reports
