See more : Tecnisco, Ltd. (2962.T) Income Statement Analysis – Financial Results
Complete financial analysis of Air France-KLM SA (AFRAF) income statement, including revenue, profit margins, EPS and key performance metrics. Get detailed insights into the financial performance of Air France-KLM SA, a leading company in the Airlines, Airports & Air Services industry within the Industrials sector.
- Qingdao Gaoce Technology Co., Ltd (688556.SS) Income Statement Analysis – Financial Results
- RenuEn Corporation (RENU) Income Statement Analysis – Financial Results
- Funeng Oriental Equipment Technology Co., Ltd. (300173.SZ) Income Statement Analysis – Financial Results
- SportsMap Tech Acquisition Corp. (SMAP) Income Statement Analysis – Financial Results
- Via Renewables, Inc. (VIA) Income Statement Analysis – Financial Results
Air France-KLM SA (AFRAF)
About Air France-KLM SA
Air France-KLM SA, together with its subsidiaries, provides passenger and cargo transportation services on scheduled flights in Metropolitan France, Benelux, rest of Europe, and internationally. The company operates through Network, Maintenance, Transavia, and Other segments. It also offers airframe and engine maintenance services; component support services comprising electronic, mechanical, pneumatic, hydraulic, etc.; and other services, as well as operates point-to-point flights to/from the Netherlands and France. As of December 31, 2021, it operated a fleet of 332 aircraft. The company was founded in 1919 and is headquartered in Paris, France.
| Metric | 2023 | 2022 | 2021 | 2020 | 2019 | 2018 | 2017 | 2016 | 2015 | 2014 | 2013 | 2012 | 2011 | 2010 | 2009 | 2008 | 2007 | 2006 | 2005 | 2004 | 2003 |
|---|---|---|---|---|---|---|---|---|---|---|---|---|---|---|---|---|---|---|---|---|---|
| Revenue | 30.02B | 26.39B | 14.32B | 11.09B | 27.19B | 26.52B | 25.78B | 24.85B | 26.06B | 24.93B | 25.53B | 25.65B | 24.40B | 21.00B | 23.98B | 24.12B | 23.08B | 21.45B | 19.08B | 12.34B | 12.67B |
| Cost of Revenue | 23.85B | 18.42B | 11.22B | 11.09B | 18.50B | 17.59B | 17.14B | 16.91B | 20.71B | 18.03B | 18.46B | 19.13B | 17.98B | 15.63B | 14.93B | 13.81B | 13.10B | 12.09B | 10.69B | 6.75B | 7.16B |
| Gross Profit | 6.17B | 7.97B | 3.10B | 1.00M | 8.69B | 8.92B | 8.64B | 7.94B | 5.35B | 6.90B | 7.07B | 6.52B | 6.42B | 5.37B | 9.05B | 10.30B | 9.98B | 9.36B | 8.39B | 5.58B | 5.50B |
| Gross Profit Ratio | 20.55% | 30.20% | 21.66% | 0.01% | 31.98% | 33.65% | 33.52% | 31.95% | 20.54% | 27.68% | 27.70% | 25.44% | 26.31% | 25.57% | 37.73% | 42.72% | 43.23% | 43.64% | 43.98% | 45.25% | 43.45% |
| Research & Development | 0.00 | 0.00 | 0.00 | 0.00 | 0.00 | 0.00 | 0.00 | 0.00 | 0.00 | 0.00 | 0.00 | 0.00 | 0.00 | 0.00 | 0.00 | 0.00 | 0.00 | 0.00 | 0.00 | 0.00 | 0.00 |
| General & Administrative | 0.00 | 0.00 | 2.56B | 2.40B | 4.27B | 4.35B | 4.11B | 3.97B | 1.66B | 3.79B | 3.74B | 3.70B | 3.82B | 3.68B | 0.00 | 0.00 | 0.00 | 0.00 | 0.00 | 0.00 | 3.85B |
| Selling & Marketing | 1.03B | 887.00M | 385.00M | 346.00M | 1.03B | 1.03B | 935.00M | 905.00M | 896.00M | 870.00M | 852.00M | 876.00M | 847.00M | 854.00M | 0.00 | 0.00 | 0.00 | 0.00 | 0.00 | 0.00 | 0.00 |
| SG&A | 1.03B | 887.00M | 2.95B | 2.75B | 5.30B | 5.38B | 5.05B | 4.87B | 2.56B | 4.66B | 4.59B | 4.58B | 4.67B | 4.54B | 0.00 | 0.00 | 0.00 | 0.00 | 0.00 | 0.00 | 3.85B |
| Other Expenses | 3.46B | -53.00M | -930.00M | -2.00M | -5.00M | 3.00M | -1.90B | 8.00M | 14.00M | 711.00M | -116.00M | -40.00M | -144.00M | 20.00M | 0.00 | 0.00 | 0.00 | 0.00 | -21.00M | -22.00M | -111.80M |
| Operating Expenses | 4.49B | 6.94B | 4.74B | 4.65B | 7.61B | 7.58B | 7.16B | 6.99B | 4.88B | 7.01B | 6.96B | 6.93B | 6.80B | 7.01B | 9.24B | 9.03B | 8.74B | 7.91B | 7.89B | 5.44B | 5.30B |
| Cost & Expenses | 28.34B | 25.36B | 15.96B | 15.73B | 26.11B | 25.17B | 24.30B | 23.90B | 25.59B | 25.04B | 25.42B | 26.05B | 24.78B | 22.64B | 24.17B | 22.85B | 21.84B | 20.00B | 18.58B | 12.20B | 12.46B |
| Interest Income | 111.00M | 40.00M | 23.00M | 26.00M | 47.00M | 36.00M | 29.00M | 37.00M | 46.00M | 51.00M | 51.00M | 55.00M | 60.00M | 85.00M | 268.00M | 288.00M | 267.00M | 168.00M | 137.00M | 0.00 | 0.00 |
| Interest Expense | 890.00M | 685.00M | 657.00M | 580.00M | 597.00M | 454.00M | 184.00M | 229.00M | 284.00M | 330.00M | 356.00M | 342.00M | 365.00M | 358.00M | 368.00M | 387.00M | 407.00M | 392.00M | 219.00M | 60.00M | 60.00M |
| Depreciation & Amortization | 2.63B | 2.83B | 2.63B | 2.88B | 3.13B | 3.00B | 2.76B | 1.57B | 1.63B | 1.73B | 1.74B | 1.75B | 1.70B | 1.68B | 1.72B | 1.62B | 1.79B | 1.77B | 1.59B | 1.18B | 1.21B |
| EBITDA | 4.67B | 3.72B | -379.00M | -3.64B | 3.88B | 4.07B | 3.44B | 2.55B | 2.08B | 2.08B | 1.56B | 1.15B | 1.03B | 2.57B | -44.00M | 3.16B | 3.17B | 3.32B | 2.19B | -8.49B | 1.34B |
| EBITDA Ratio | 15.55% | 12.27% | -4.14% | -14.04% | 14.59% | 14.85% | 5.71% | 9.74% | 6.50% | 8.45% | 6.88% | 5.28% | 4.30% | 0.38% | 3.68% | 13.10% | 14.36% | 15.65% | 11.49% | 10.85% | 11.26% |
| Operating Income | 1.68B | 1.19B | -2.53B | -6.00B | 1.01B | 1.32B | -419.00M | 1.12B | 1.12B | 751.00M | -227.00M | -880.00M | -480.00M | -1.63B | -193.00M | 1.27B | 1.23B | 1.46B | 497.00M | 139.00M | 191.53M |
| Operating Income Ratio | 5.59% | 4.52% | -17.69% | -54.11% | 3.71% | 4.98% | -1.63% | 4.49% | 4.28% | 3.01% | -0.89% | -3.43% | -1.97% | -7.77% | -0.81% | 5.27% | 5.34% | 6.78% | 2.61% | 1.13% | 1.51% |
| Total Other Income/Expenses | -530.00M | -840.00M | -1.04B | -928.00M | -664.00M | -762.00M | 113.00M | -293.00M | -914.00M | -729.00M | -301.00M | -275.00M | -551.00M | 2.07B | -497.00M | -2.48B | -163.00M | -337.00M | -255.00M | 1.15B | -39.00M |
| Income Before Tax | 1.15B | 342.00M | -3.55B | -6.93B | 346.00M | 623.00M | -517.00M | 823.00M | 200.00M | 63.00M | -528.00M | -1.09B | -1.03B | -2.13B | -1.20B | 1.15B | 1.12B | 1.20B | 455.00M | 100.00M | 110.89M |
| Income Before Tax Ratio | 3.82% | 1.30% | -24.79% | -62.48% | 1.27% | 2.35% | -2.01% | 3.31% | 0.77% | 0.25% | -2.07% | -4.27% | -4.23% | -10.14% | -5.02% | 4.76% | 4.84% | 5.59% | 2.38% | 0.81% | 0.88% |
| Income Tax Expense | 164.00M | -390.00M | -282.00M | 97.00M | 76.00M | 227.00M | -229.00M | 294.00M | 43.00M | 209.00M | 957.00M | 27.00M | -245.00M | -586.00M | -439.00M | 358.00M | 248.00M | 256.00M | 96.00M | 2.00M | -12.83M |
| Net Income | 934.00M | 728.00M | -3.29B | -7.08B | 290.00M | 409.00M | -274.00M | 792.00M | 118.00M | -198.00M | -1.83B | -1.19B | -809.00M | -1.56B | -814.00M | 748.00M | 891.00M | 913.00M | 351.00M | 93.00M | 120.05M |
| Net Income Ratio | 3.11% | 2.76% | -23.00% | -63.83% | 1.07% | 1.54% | -1.06% | 3.19% | 0.45% | -0.79% | -7.16% | -4.65% | -3.32% | -7.42% | -3.40% | 3.10% | 3.86% | 4.26% | 1.84% | 0.75% | 0.95% |
| EPS | 3.37 | 3.49 | -28.69 | -83.52 | 3.42 | 4.83 | 3.94 | 16.78 | 2.50 | -5.65 | -59.21 | -20.32 | -13.81 | -26.71 | -13.95 | 12.80 | 15.79 | 17.31 | 6.72 | 1.81 | 2.79 |
| EPS Diluted | 3.92 | 3.09 | -28.69 | -83.52 | 3.21 | 4.83 | 3.90 | 14.79 | 3.66 | -5.65 | -61.69 | -20.32 | -13.81 | -26.71 | -13.95 | 12.80 | 14.60 | 15.55 | 6.23 | 1.81 | 2.79 |
| Weighted Avg Shares Out | 229.00M | 235.66M | 114.74M | 84.75M | 84.75M | 84.75M | 73.48M | 58.73M | 58.70M | 35.06M | 30.86M | 58.66M | 58.59M | 58.37M | 58.37M | 58.43M | 56.44M | 52.74M | 52.23M | 51.29M | 43.01M |
| Weighted Avg Shares Out (Dil) | 196.88M | 235.66M | 114.74M | 84.75M | 90.28M | 84.75M | 73.48M | 69.32M | 32.27M | 35.04M | 29.62M | 58.66M | 58.59M | 58.37M | 58.37M | 58.43M | 61.02M | 58.73M | 56.36M | 51.33M | 43.01M |
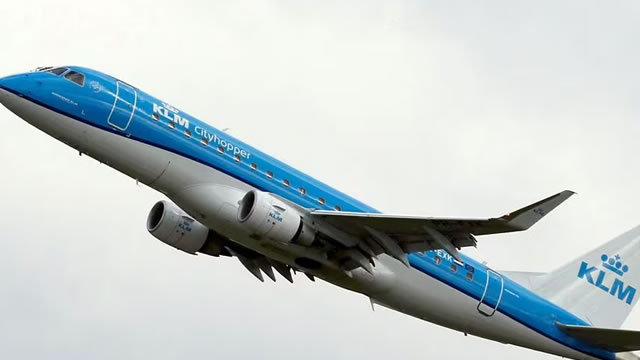
KLM in Dutch court to answer 'greenwashing' allegation

As Airlines Face Greenwashing Accusations, Google And IATA Crunch Data

Air France KLM 'confident' about Brazil after strong 2023

Air France, Lufthansa and Etihad UK ads banned for greenwashing

Air France-KLM Dodges Shocking Aviation War With The U.S.

HydrogenPro Partner, DG Fuels announces strategic cooperation with Air France- KLM

Air France-KLM SA (AFRAF) Q3 2023 Earnings Call Transcript

Air France-KLM joins airlines reporting record profits
Shares in Air France and British Airways owner IAG fall despite record profits, as Middle East threat looms

JETS: Airline Stocks Are High Risk With Potential
Source: https://incomestatements.info
Category: Stock Reports
