See more : Embry Holdings Limited (1388.HK) Income Statement Analysis – Financial Results
Complete financial analysis of Akanda Corp. (AKAN) income statement, including revenue, profit margins, EPS and key performance metrics. Get detailed insights into the financial performance of Akanda Corp., a leading company in the Drug Manufacturers – Specialty & Generic industry within the Healthcare sector.
- FSPG Hi-Tech CO., Ltd. (000973.SZ) Income Statement Analysis – Financial Results
- Jayaswal Neco Industries Limited (JAYNECOIND.BO) Income Statement Analysis – Financial Results
- Danske Invest Fjernøsten Indeks (DKIFJIX.CO) Income Statement Analysis – Financial Results
- Al Rashid Industrial Co. (9580.SR) Income Statement Analysis – Financial Results
- Robex Resources Inc. (RSRBF) Income Statement Analysis – Financial Results
Akanda Corp. (AKAN)
Industry: Drug Manufacturers - Specialty & Generic
Sector: Healthcare
Website: https://www.akandacorp.com
About Akanda Corp.
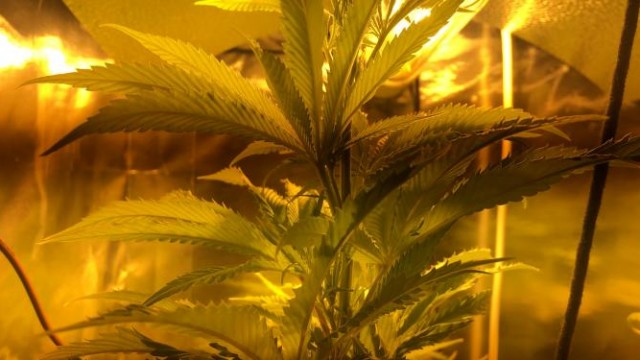
Akanda Corp., through its subsidiaries, engages in the cultivation, manufacture, and distribution of cannabis products in the United Kingdom, Lesotho, and internationally. It intends to supply cannabis based medical and wellness products. The company was incorporated in 2021 and is headquartered in New Romney, the United Kingdom.
| Metric | 2023 | 2022 | 2021 | 2020 | 2019 |
|---|---|---|---|---|---|
| Revenue | 2.16M | 2.62M | 41.43K | 2.06K | 0.00 |
| Cost of Revenue | 2.05M | 649.88K | 756.16K | 1.81K | 198.82K |
| Gross Profit | 111.45K | 1.97M | -714.73K | 253.00 | -198.82K |
| Gross Profit Ratio | 5.16% | 75.19% | -1,725.10% | 12.27% | 0.00% |
| Research & Development | 0.00 | 0.00 | 0.00 | 0.00 | 0.00 |
| General & Administrative | 5.88M | 19.85M | 5.81M | 1.36M | 702.41K |
| Selling & Marketing | 0.00 | 0.00 | 0.00 | 0.00 | 0.00 |
| SG&A | 5.88M | 19.85M | 5.81M | 1.36M | 702.41K |
| Other Expenses | 4.28M | 3.60M | 309.02K | 307.30K | 198.82K |
| Operating Expenses | 10.16M | 23.45M | 6.12M | 1.67M | 901.24K |
| Cost & Expenses | 12.21M | 22.80M | 6.88M | 1.67M | 901.24K |
| Interest Income | 39.00 | 886.00 | 26.75K | 10.19K | 401.00 |
| Interest Expense | 255.66K | 115.32K | 1.09M | 645.16K | 493.81K |
| Depreciation & Amortization | 4.28M | 3.60M | 309.02K | 248.74K | 198.82K |
| EBITDA | -27.74M | -4.52M | -2.15M | -1.41M | -702.01K |
| EBITDA Ratio | -1,284.03% | -626.47% | -15,683.67% | -68,212.22% | 0.00% |
| Operating Income | -10.05M | -20.18M | -6.83M | -1.67M | -901.24K |
| Operating Income Ratio | -465.33% | -770.18% | -16,494.24% | -80,787.34% | 0.00% |
| Total Other Income/Expenses | -22.22M | 11.94M | 96.45K | -634.87K | -493.41K |
| Income Before Tax | -32.28M | -8.24M | -8.13M | -2.30M | -1.39M |
| Income Before Tax Ratio | -1,494.18% | -314.37% | -19,625.88% | -111,569.88% | 0.00% |
| Income Tax Expense | 0.00 | -8.63M | 1.09M | 645.40K | 493.81K |
| Net Income | -32.28M | 397.05K | -9.22M | -2.95M | -1.89M |
| Net Income Ratio | -1,494.18% | 15.16% | -22,263.84% | -142,869.59% | 0.00% |
| EPS | -7.16 | 4.59 | -127.66 | -40.77 | -26.14 |
| EPS Diluted | -7.16 | 4.59 | -127.66 | -40.77 | -26.14 |
| Weighted Avg Shares Out | 4.51M | 86.59K | 72.26K | 72.26K | 72.26K |
| Weighted Avg Shares Out (Dil) | 4.51M | 86.59K | 72.26K | 72.26K | 72.26K |

Akanda pivots to German market as cannabis reform gains traction

Weed Stocks This Week: Major Earnings Blitz

Best Penny Stocks To Buy? 4 To Watch Right Now

These 7 Cannabis Stocks Just Dropped Smoking Hot News

Are These Cannabis Stocks Heating Up or Just Blowing Smoke?

It's 420 Holiday Week! These 9 Cannabis Stocks Are on Fire

Akanda buys Portugal unit of Canada's Flowr

Why Akanda Stock Blasted Nearly 14% Higher Today

U.S. IPO Weekly Recap: Cannabis Micro-Cap Breaks The IPO Market's Dry Spell

10 Smoking Hot Cannabis Stocks to Keep on Your Radar
Source: https://incomestatements.info
Category: Stock Reports
