See more : Sunty Development Co., LTD (3266.TW) Income Statement Analysis – Financial Results
Complete financial analysis of Alkane Resources Limited (ALKEF) income statement, including revenue, profit margins, EPS and key performance metrics. Get detailed insights into the financial performance of Alkane Resources Limited, a leading company in the Gold industry within the Basic Materials sector.
- Ibere Pharmaceuticals (IBER-UN) Income Statement Analysis – Financial Results
- Midsona AB (publ) (MSON-B.ST) Income Statement Analysis – Financial Results
- Savosolar Oyj (SAVOS.ST) Income Statement Analysis – Financial Results
- GGX Gold Corp. (GGXXF) Income Statement Analysis – Financial Results
- Bunzl plc (BZLFF) Income Statement Analysis – Financial Results
Alkane Resources Limited (ALKEF)
About Alkane Resources Limited
Alkane Resources Limited operates as a gold production company in Australia. It explores for gold, copper, nickel, zinc, and silver deposits. The company holds various interests in the Tomingley Gold project that consists of four gold deposits; and the Northern Molong Porphyry Project, which covers an area of 115 square kilometers located in the Central West of New South Wales. Its exploration projects comprise Boda and Kaiser, Cudal, Peak Hill, Elsienora, Rockley, Armstrongs, Trangie, and Mt Conqueror projects. The company also invests in junior gold mining companies and projects. Alkane Resources Limited was incorporated in 1969 and is headquartered in West Perth, Australia.
| Metric | 2024 | 2023 | 2022 | 2021 | 2020 | 2019 | 2018 | 2017 | 2016 | 2015 | 2014 | 2013 |
|---|---|---|---|---|---|---|---|---|---|---|---|---|
| Revenue | 172.99M | 190.53M | 165.01M | 127.83M | 72.55M | 92.51M | 128.80M | 117.34M | 109.13M | 102.47M | 25.26M | 2.74M |
| Cost of Revenue | 102.91M | 126.06M | 107.71M | 70.46M | 44.51M | 62.90M | 91.88M | 102.35M | 97.97M | 101.49M | 25.58M | 156.00K |
| Gross Profit | 70.09M | 64.46M | 57.30M | 57.37M | 28.04M | 29.61M | 36.92M | 14.99M | 11.16M | 980.00K | -319.00K | 2.58M |
| Gross Profit Ratio | 40.51% | 33.83% | 34.73% | 44.88% | 38.65% | 32.01% | 28.67% | 12.77% | 10.23% | 0.96% | -1.26% | 94.31% |
| Research & Development | 0.00 | 0.00 | 0.00 | 0.00 | 0.00 | 0.00 | 0.00 | 0.00 | 0.00 | 0.00 | 0.00 | 0.00 |
| General & Administrative | 8.16M | 9.94M | 8.38M | 8.63M | 7.63M | 0.00 | 4.42M | 3.92M | 3.85M | 4.18M | 4.28M | 3.68M |
| Selling & Marketing | 0.00 | -4.35M | -3.36M | -1.81M | 128.00K | 0.00 | 3.09M | 1.86M | 1.75M | 2.67M | 1.77M | 586.00K |
| SG&A | 8.16M | 5.60M | 5.03M | 6.83M | 7.76M | 5.69M | 7.50M | 5.78M | 5.60M | 6.85M | 6.06M | 4.27M |
| Other Expenses | 61.92M | 430.00K | 49.45M | 667.00K | -167.00K | 0.00 | 0.00 | 0.00 | 0.00 | 0.00 | 0.00 | 0.00 |
| Operating Expenses | 70.09M | 5.60M | 5.03M | 6.16M | 7.76M | 5.69M | 7.50M | 5.78M | 5.60M | 8.97M | 759.00K | 196.97M |
| Cost & Expenses | 172.99M | 131.66M | 112.73M | 76.62M | 52.27M | 68.59M | 99.38M | 108.13M | 103.57M | 110.46M | 26.34M | 197.12M |
| Interest Income | 2.53M | 2.40M | 69.00K | 94.00K | 625.00K | 837.00K | 1.18M | 454.00K | 490.00K | 144.00K | 199.00K | 74.00K |
| Interest Expense | 2.35M | 610.00K | 909.00K | 870.00K | 109.00K | 69.00K | 143.00K | 1.04M | 436.00K | 373.00K | 369.00K | 0.00 |
| Depreciation & Amortization | 36.14M | 36.56M | 35.22M | 21.31M | 9.28M | 7.59M | 38.74M | 42.91M | 30.38M | 27.80M | 10.89M | 60.55M |
| EBITDA | 62.93M | 97.75M | 87.50M | 72.16M | 29.30M | 31.50M | 68.16M | 52.12M | 35.94M | 20.46M | 3.37M | 57.95M |
| EBITDA Ratio | 36.38% | 50.08% | 53.03% | 56.73% | 40.74% | 34.05% | 52.92% | 44.42% | 32.93% | 19.97% | 13.35% | 2,114.82% |
| Operating Income | 23.64M | 58.87M | 52.28M | 51.21M | 20.28M | 23.92M | 29.42M | 9.21M | 5.56M | -7.34M | -7.52M | -2.61M |
| Operating Income Ratio | 13.67% | 30.90% | 31.68% | 40.06% | 27.95% | 25.85% | 22.84% | 7.85% | 5.10% | -7.16% | -29.76% | -95.11% |
| Total Other Income/Expenses | 799.00K | 1.72M | 48.22M | -2.27M | -165.00K | 1.47M | 1.62M | -42.78M | 1.10M | -501.00K | 6.24M | -191.85M |
| Income Before Tax | 24.44M | 60.59M | 100.49M | 48.94M | 20.15M | 25.39M | 31.32M | -33.57M | 6.66M | -8.14M | -1.28M | -194.46M |
| Income Before Tax Ratio | 14.13% | 31.80% | 60.90% | 38.28% | 27.78% | 27.44% | 24.31% | -28.61% | 6.11% | -7.94% | -5.05% | -7,096.93% |
| Income Tax Expense | 6.77M | 18.14M | 30.22M | 14.50M | 6.57M | 2.27M | 6.85M | -4.63M | 1.97M | 4.05M | 4.89M | 61.62M |
| Net Income | 17.68M | 42.45M | 70.25M | 55.70M | 12.76M | 23.29M | 24.47M | -28.94M | 4.70M | -4.09M | -6.17M | -132.84M |
| Net Income Ratio | 10.22% | 22.28% | 42.57% | 43.57% | 17.59% | 25.18% | 19.00% | -24.66% | 4.30% | -3.99% | -24.42% | -4,848.03% |
| EPS | 0.03 | 0.07 | 0.12 | 0.09 | 0.02 | 0.05 | 0.05 | -0.06 | 0.01 | -0.01 | -0.02 | -0.36 |
| EPS Diluted | 0.03 | 0.07 | 0.12 | 0.09 | 0.02 | 0.04 | 0.05 | -0.06 | 0.01 | -0.01 | -0.02 | -0.36 |
| Weighted Avg Shares Out | 602.92M | 598.22M | 595.53M | 594.73M | 547.02M | 506.60M | 506.42M | 503.38M | 421.21M | 408.60M | 362.96M | 373.13M |
| Weighted Avg Shares Out (Dil) | 612.60M | 606.04M | 603.63M | 599.94M | 564.17M | 519.90M | 513.38M | 503.38M | 425.24M | 416.22M | 372.71M | 373.13M |
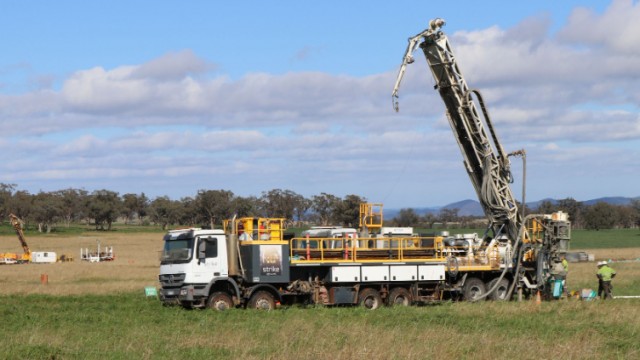
Alkane Resources intersects further broad gold and copper northwest of Boda discovery, shares open higher
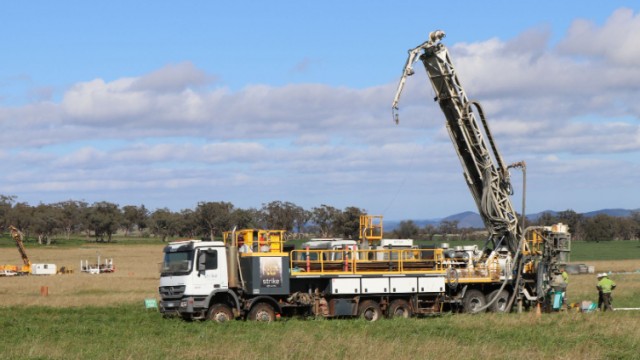
Alkane Resources continues to grow Boda system with more broad gold-copper intersections

Alkane Resources price target gets 15% boost to $1.50 by Ord Minnett following Tomingley study, FY22 guidance
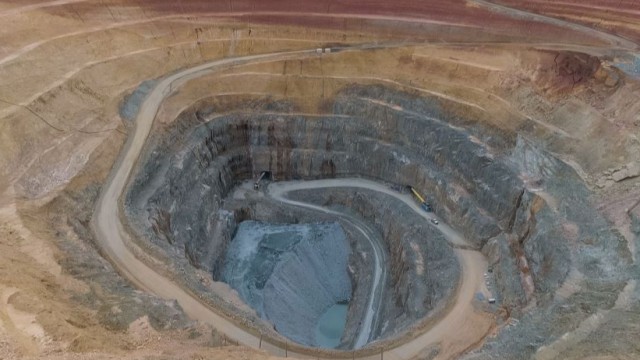
Alkane Resources expands Tomingley growth promise with multiple new gold intercepts
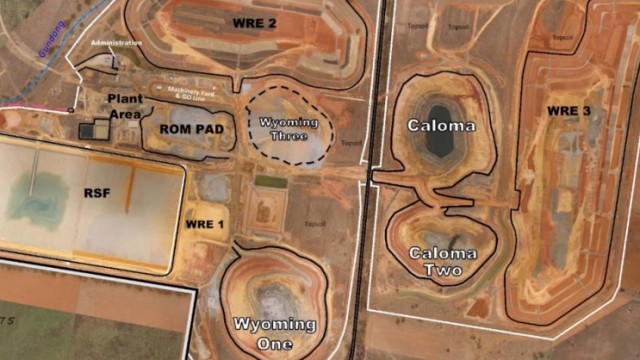
Alkane Resources reviews gold mineral resource and ore reserves for FY21
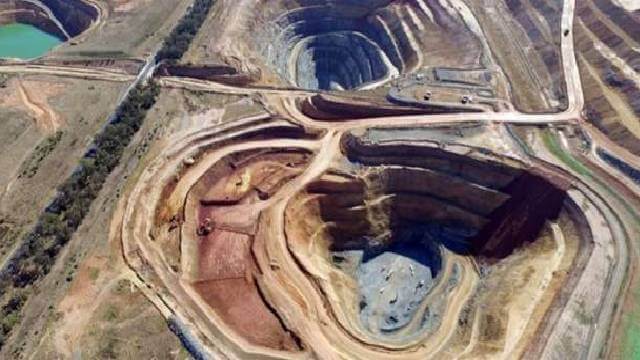
Alkane Resources delivers FY21 profit after tax of A$55.7 million

Alkane Resources continues to enhance gold story in Central West NSW through production, development and exploration
Australian Strategic Materials advances towards production at Korean Metals Plant in second half 2021
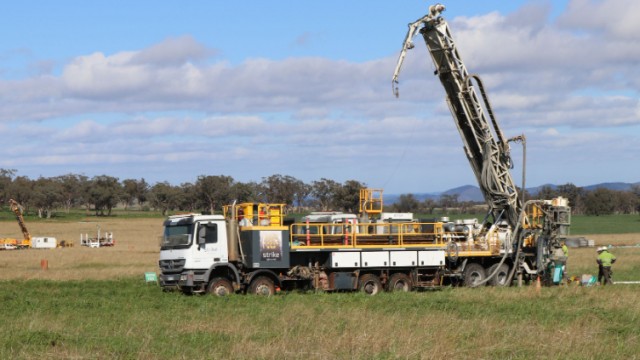
Alkane Resources new Boda gold-copper results bode well for budding multi-mine producer

Alkane Resources halted with update pending on exploration results from Boda Project
Source: https://incomestatements.info
Category: Stock Reports
