See more : Vishnu Prakash R Punglia Limited (VPRPL.NS) Income Statement Analysis – Financial Results
Complete financial analysis of Ambarella, Inc. (AMBA) income statement, including revenue, profit margins, EPS and key performance metrics. Get detailed insights into the financial performance of Ambarella, Inc., a leading company in the Semiconductors industry within the Technology sector.
- ams-OSRAM AG (AMS.SW) Income Statement Analysis – Financial Results
- 3Power Energy Group, Inc. (PSPW) Income Statement Analysis – Financial Results
- Nippon Coke & Engineering Company, Limited (3315.T) Income Statement Analysis – Financial Results
- EMP Metals Corp. (EMPPF) Income Statement Analysis – Financial Results
- Shandong Huatai Paper Industry Shareholding Co.,Ltd (600308.SS) Income Statement Analysis – Financial Results
Ambarella, Inc. (AMBA)
About Ambarella, Inc.
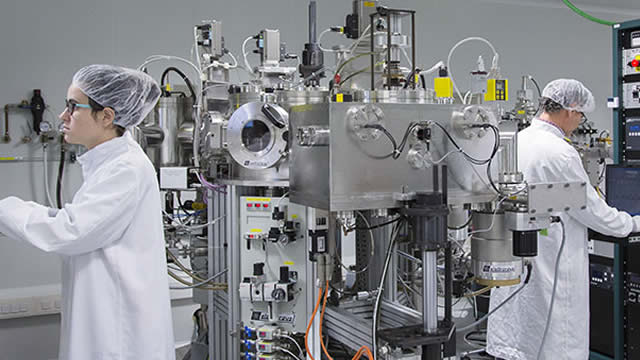
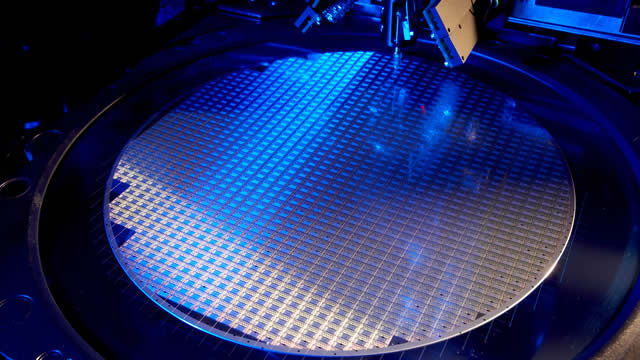
Ambarella, Inc. develops semiconductor solutions for video that enable high-definition (HD) and ultra HD compression, image processing, and deep neural network processing worldwide. The company's system-on-a-chip designs integrated HD video processing, image processing, artificial intelligence computer vision algorithms, audio processing, and system functions onto a single chip for delivering video and image quality, differentiated functionality, and low power consumption. Its solutions are used in automotive cameras, such as automotive video recorders, electronic mirrors, front advanced driver assistance system camera, cabin monitoring system and driver monitoring system camera, and central domain controllers for autonomous vehicle; and professional and home internet protocol security camera; robotics and industrial application, including identification/authentication cameras, robotic products, and sensing cameras, as well as cameras for the home, public spaces, and consumer leisure comprising wearable body cameras, sports action cameras, social media cameras, drones for capturing aerial video or photographs, video conferencing, and virtual reality applications. The company sells its solutions to original design manufacturers and original equipment manufacturers through its direct sales force and distributors. Ambarella, Inc. was incorporated in 2004 and is headquartered in Santa Clara, California.
| Metric | 2024 | 2023 | 2022 | 2021 | 2020 | 2019 | 2018 | 2017 | 2016 | 2015 | 2014 | 2013 | 2012 | 2011 | 2010 |
|---|---|---|---|---|---|---|---|---|---|---|---|---|---|---|---|
| Revenue | 226.47M | 337.61M | 331.86M | 222.99M | 228.73M | 227.77M | 295.40M | 310.30M | 316.37M | 218.28M | 157.61M | 121.07M | 97.26M | 94.74M | 71.53M |
| Cost of Revenue | 89.66M | 128.67M | 123.72M | 87.42M | 96.02M | 89.62M | 107.67M | 105.28M | 111.03M | 79.14M | 57.76M | 40.41M | 32.46M | 34.50M | 24.05M |
| Gross Profit | 136.82M | 208.93M | 208.13M | 135.57M | 132.71M | 138.14M | 187.73M | 205.01M | 205.34M | 139.14M | 99.85M | 80.66M | 64.80M | 60.24M | 47.48M |
| Gross Profit Ratio | 60.41% | 61.89% | 62.72% | 60.80% | 58.02% | 60.65% | 63.55% | 66.07% | 64.91% | 63.74% | 63.35% | 66.63% | 66.63% | 63.58% | 66.38% |
| Research & Development | 215.05M | 204.95M | 167.34M | 140.76M | 129.72M | 128.08M | 115.51M | 101.21M | 82.93M | 57.98M | 48.78M | 42.83M | 37.62M | 34.45M | 27.64M |
| General & Administrative | 0.00 | 0.00 | 0.00 | 0.00 | 0.00 | 50.48M | 47.79M | 43.45M | 37.74M | 29.30M | 23.15M | 17.93M | 15.93M | 10.31M | 6.89M |
| Selling & Marketing | 0.00 | 0.00 | 0.00 | 0.00 | 0.00 | 0.00 | 0.00 | 0.00 | 0.00 | 0.00 | 0.00 | 0.00 | 0.00 | 0.00 | 0.00 |
| SG&A | 76.33M | 78.24M | 70.44M | 55.98M | 52.63M | 50.48M | 47.79M | 43.45M | 37.74M | 29.30M | 23.15M | 17.93M | 15.93M | 10.31M | 6.89M |
| Other Expenses | 0.00 | 3.32M | 1.00M | 3.86M | 8.02M | 5.87M | 1.30M | 518.00K | 530.00K | 175.00K | -22.00K | 136.00K | -90.00K | 0.00 | -114.00K |
| Operating Expenses | 291.38M | 283.19M | 237.78M | 196.74M | 182.36M | 178.56M | 163.30M | 144.65M | 120.67M | 87.28M | 71.93M | 60.76M | 53.54M | 44.76M | 34.53M |
| Cost & Expenses | 381.03M | 411.86M | 361.50M | 284.16M | 278.38M | 268.19M | 270.97M | 249.93M | 231.69M | 166.42M | 129.69M | 101.16M | 86.00M | 79.26M | 58.58M |
| Interest Income | 0.00 | 0.00 | 0.00 | 4.32M | 7.05M | 0.00 | 0.00 | 0.00 | 0.00 | 0.00 | 0.00 | 0.00 | 0.00 | 0.00 | 0.00 |
| Interest Expense | 0.00 | 0.00 | 0.00 | 0.00 | 0.00 | 0.00 | 0.00 | 0.00 | 0.00 | 0.00 | 0.00 | 0.00 | 0.00 | 0.00 | 0.00 |
| Depreciation & Amortization | 24.81M | 19.93M | 14.01M | 11.97M | 11.63M | 7.22M | 4.77M | 1.59M | 1.61M | 1.34M | 1.10M | 1.01M | 1.14M | 1.60M | 1.30M |
| EBITDA | -129.75M | -54.32M | -14.63M | -49.20M | -38.02M | -33.20M | 29.20M | 61.95M | 86.29M | 53.20M | 29.01M | 20.91M | 12.39M | 17.13M | 14.25M |
| EBITDA Ratio | -57.29% | -21.99% | -8.93% | -27.43% | -21.71% | -17.75% | 8.27% | 19.45% | 26.77% | 23.76% | 17.71% | 16.44% | 12.74% | 18.08% | 19.92% |
| Operating Income | -154.56M | -74.26M | -29.64M | -61.17M | -49.65M | -40.42M | 24.43M | 60.36M | 84.68M | 51.86M | 27.92M | 19.91M | 11.26M | 15.48M | 12.95M |
| Operating Income Ratio | -68.25% | -21.99% | -8.93% | -27.43% | -21.71% | -17.75% | 8.27% | 19.45% | 26.77% | 23.76% | 17.71% | 16.44% | 11.57% | 16.34% | 18.10% |
| Total Other Income/Expenses | 6.03M | 3.32M | 1.00M | 3.86M | 8.02M | 5.87M | 1.30M | 518.00K | 530.00K | 175.00K | -22.00K | 136.00K | -90.00K | -47.00K | -114.00K |
| Income Before Tax | -148.53M | -70.94M | -28.64M | -57.30M | -41.63M | -34.55M | 25.73M | 60.88M | 85.21M | 52.04M | 27.90M | 20.04M | 11.17M | 15.43M | 12.83M |
| Income Before Tax Ratio | -65.58% | -21.01% | -8.63% | -25.70% | -18.20% | -15.17% | 8.71% | 19.62% | 26.93% | 23.84% | 17.70% | 16.55% | 11.48% | 16.29% | 17.94% |
| Income Tax Expense | 20.89M | -5.55M | -2.23M | 2.48M | 3.16M | -4.11M | 6.88M | 3.07M | 8.70M | 1.47M | 2.24M | 1.85M | 1.34M | 1.50M | -454.00K |
| Net Income | -169.42M | -65.39M | -26.41M | -59.79M | -44.79M | -30.45M | 18.85M | 57.81M | 76.51M | 50.57M | 25.65M | 18.19M | 9.82M | 13.93M | 13.29M |
| Net Income Ratio | -74.81% | -19.37% | -7.96% | -26.81% | -19.58% | -13.37% | 6.38% | 18.63% | 24.18% | 23.17% | 16.28% | 15.02% | 10.10% | 14.70% | 18.58% |
| EPS | -4.25 | -1.70 | -0.72 | -1.72 | -1.35 | -0.93 | 0.57 | 1.77 | 2.42 | 1.70 | 0.93 | 0.64 | 0.12 | 0.19 | 0.64 |
| EPS Diluted | -4.25 | -1.70 | -0.72 | -1.72 | -1.35 | -0.93 | 0.55 | 1.68 | 2.27 | 1.57 | 0.85 | 0.60 | 0.12 | 0.19 | 0.59 |
| Weighted Avg Shares Out | 39.88M | 38.36M | 36.58M | 34.68M | 33.08M | 32.71M | 33.22M | 32.67M | 31.63M | 29.74M | 27.68M | 13.51M | 20.87M | 20.87M | 20.87M |
| Weighted Avg Shares Out (Dil) | 39.88M | 38.36M | 36.58M | 34.68M | 33.08M | 32.71M | 34.58M | 34.33M | 33.76M | 32.28M | 30.17M | 15.02M | 22.41M | 22.41M | 22.41M |

Ambarella, Inc. Announces Second Quarter Fiscal Year 2025 Financial Results

Ambarella Earnings Are Imminent; These Most Accurate Analysts Revise Forecasts Ahead Of Earnings Call

Ambarella: Headwinds May Put A Stop To The Turnaround

Ambarella Announces Second Quarter Fiscal Year 2025 Earnings Conference Call to be Held August 27, 2024

What Are the Hottest Autonomous Driving Stocks Right Now? 3 Top Picks.

Ambarella and Plus Announce High Performance Transformer-Based AD Perception Software Stack, PlusVision™, for CV3-AD AI Domain Controller Family With Industry-Leading Power Efficiency

Stocks & ETFs to Bet on Back-To-School Season

1 Growth Stock Down 73% That Can Benefit Dramatically From Artificial Intelligence (AI)

3 Quiet Machine Learning Stocks to Buy Before AI Makes Them Famous

7 Futuristic Tech Stocks to Tap Into ASAP
Source: https://incomestatements.info
Category: Stock Reports
