See more : Phinergy Ltd. (PHNGF) Income Statement Analysis – Financial Results
Complete financial analysis of Advanced Micro Devices, Inc. (AMD) income statement, including revenue, profit margins, EPS and key performance metrics. Get detailed insights into the financial performance of Advanced Micro Devices, Inc., a leading company in the Semiconductors industry within the Technology sector.
- ADS-TEC Energy PLC (ADSEW) Income Statement Analysis – Financial Results
- Ayujoy Herbals Ltd. (AJOY) Income Statement Analysis – Financial Results
- CK SAN-ETSU Co., Ltd. (5757.T) Income Statement Analysis – Financial Results
- CONTAINE TECHNOLOGIES LIMITED (CONTAINE.BO) Income Statement Analysis – Financial Results
- InfoBeans Technologies Limited (INFOBEAN.BO) Income Statement Analysis – Financial Results
Advanced Micro Devices, Inc. (AMD)
About Advanced Micro Devices, Inc.
Advanced Micro Devices, Inc. operates as a semiconductor company worldwide. The company operates in two segments, Computing and Graphics; and Enterprise, Embedded and Semi-Custom. Its products include x86 microprocessors as an accelerated processing unit, chipsets, discrete and integrated graphics processing units (GPUs), data center and professional GPUs, and development services; and server and embedded processors, and semi-custom System-on-Chip (SoC) products, development services, and technology for game consoles. The company provides processors for desktop and notebook personal computers under the AMD Ryzen, AMD Ryzen PRO, Ryzen Threadripper, Ryzen Threadripper PRO, AMD Athlon, AMD Athlon PRO, AMD FX, AMD A-Series, and AMD PRO A-Series processors brands; discrete GPUs for desktop and notebook PCs under the AMD Radeon graphics, AMD Embedded Radeon graphics brands; and professional graphics products under the AMD Radeon Pro and AMD FirePro graphics brands. It also offers Radeon Instinct, Radeon PRO V-series, and AMD Instinct accelerators for servers; chipsets under the AMD trademark; microprocessors for servers under the AMD EPYC; embedded processor solutions under the AMD Athlon, AMD Geode, AMD Ryzen, AMD EPYC, AMD R-Series, and G-Series processors brands; and customer-specific solutions based on AMD CPU, GPU, and multi-media technologies, as well as semi-custom SoC products. It serves original equipment manufacturers, public cloud service providers, original design manufacturers, system integrators, independent distributors, online retailers, and add-in-board manufacturers through its direct sales force, independent distributors, and sales representatives. The company was incorporated in 1969 and is headquartered in Santa Clara, California.
| Metric | 2023 | 2022 | 2021 | 2020 | 2019 | 2018 | 2017 | 2016 | 2015 | 2014 | 2013 | 2012 | 2011 | 2010 | 2009 | 2008 | 2007 | 2006 | 2005 | 2004 | 2003 | 2002 | 2001 | 2000 | 1999 | 1998 | 1997 | 1996 | 1995 | 1994 | 1993 | 1992 | 1991 | 1990 | 1989 | 1988 | 1987 | 1986 |
|---|---|---|---|---|---|---|---|---|---|---|---|---|---|---|---|---|---|---|---|---|---|---|---|---|---|---|---|---|---|---|---|---|---|---|---|---|---|---|
| Revenue | 22.68B | 23.60B | 16.43B | 9.76B | 6.73B | 6.48B | 5.25B | 4.32B | 3.99B | 5.51B | 5.30B | 5.42B | 6.57B | 6.49B | 5.40B | 5.81B | 6.01B | 5.65B | 5.85B | 5.00B | 3.52B | 2.70B | 3.89B | 4.64B | 2.86B | 2.54B | 2.36B | 1.95B | 2.43B | 2.13B | 1.65B | 1.51B | 1.23B | 1.06B | 1.10B | 1.13B | 997.10M | 576.10M |
| Cost of Revenue | 12.22B | 11.55B | 8.51B | 5.42B | 3.86B | 4.03B | 3.47B | 3.32B | 2.91B | 3.67B | 3.32B | 3.48B | 3.63B | 3.53B | 3.13B | 3.49B | 3.75B | 2.86B | 3.46B | 3.03B | 2.33B | 2.11B | 2.59B | 2.51B | 1.96B | 1.72B | 1.58B | 1.44B | 1.30B | 982.31M | 789.56M | 594.20M | 502.90M | 550.20M | 507.00M | 508.70M | 409.60M | 235.00M |
| Gross Profit | 10.46B | 12.05B | 7.93B | 4.35B | 2.87B | 2.45B | 1.79B | 1.00B | 1.08B | 1.84B | 1.98B | 1.94B | 2.94B | 2.96B | 2.27B | 2.32B | 2.26B | 2.79B | 2.39B | 1.97B | 1.19B | 591.37M | 1.30B | 2.13B | 893.17M | 823.44M | 777.94M | 512.19M | 1.13B | 1.15B | 858.72M | 920.30M | 723.70M | 509.00M | 597.60M | 617.20M | 587.50M | 341.10M |
| Gross Profit Ratio | 46.12% | 51.06% | 48.25% | 44.53% | 42.61% | 37.79% | 34.02% | 23.22% | 27.06% | 33.40% | 37.33% | 35.84% | 44.76% | 45.60% | 42.05% | 39.94% | 37.62% | 49.44% | 40.90% | 39.37% | 33.87% | 21.93% | 33.46% | 45.85% | 31.26% | 32.39% | 33.01% | 26.23% | 46.54% | 53.98% | 52.10% | 60.77% | 59.00% | 48.06% | 54.10% | 54.82% | 58.92% | 59.21% |
| Research & Development | 5.87B | 5.01B | 2.85B | 1.98B | 1.55B | 1.43B | 1.20B | 1.01B | 947.00M | 1.07B | 1.20B | 1.35B | 1.45B | 1.41B | 1.72B | 1.85B | 1.85B | 1.21B | 1.14B | 934.57M | 852.08M | 816.11M | 650.93M | 641.80M | 635.79M | 567.40M | 467.88M | 400.70M | 397.56M | 279.98M | 262.80M | 0.00 | 0.00 | 0.00 | 0.00 | 0.00 | 0.00 | 0.00 |
| General & Administrative | 1.66B | 1.65B | 870.00M | 681.00M | 533.00M | 386.00M | 0.00 | 0.00 | 0.00 | 0.00 | 0.00 | 0.00 | 0.00 | 0.00 | 0.00 | 0.00 | 0.00 | 0.00 | 0.00 | 0.00 | 0.00 | 0.00 | 0.00 | 0.00 | 0.00 | 0.00 | 0.00 | 0.00 | 0.00 | 0.00 | 0.00 | 0.00 | 0.00 | 0.00 | 0.00 | 0.00 | 0.00 | 0.00 |
| Selling & Marketing | 695.00M | 683.00M | 578.00M | 314.00M | 217.00M | 176.00M | 156.00M | 131.00M | 154.00M | 194.00M | 210.00M | 287.00M | 0.00 | 0.00 | 0.00 | 0.00 | 0.00 | 0.00 | 0.00 | 0.00 | 0.00 | 0.00 | 0.00 | 0.00 | 0.00 | 0.00 | 0.00 | 0.00 | 0.00 | 0.00 | 0.00 | 0.00 | 0.00 | 0.00 | 0.00 | 0.00 | 0.00 | 0.00 |
| SG&A | 2.35B | 2.34B | 1.45B | 995.00M | 750.00M | 562.00M | 516.00M | 466.00M | 482.00M | 599.00M | 674.00M | 817.00M | 992.00M | 651.00M | -248.00M | 1.30B | 1.37B | 1.14B | 1.02B | 807.01M | 587.31M | 670.07M | 620.03M | 599.02M | 540.07M | 419.68M | 400.71M | 364.80M | 385.02M | 359.23M | 290.86M | 498.10M | 458.70M | 431.90M | 422.70M | 432.50M | 451.00M | 306.10M |
| Other Expenses | 0.00 | 5.00M | -2.00M | -3.00M | -165.00M | 0.00 | 0.00 | 0.00 | 0.00 | 0.00 | 0.00 | 0.00 | 29.00M | -226.00M | 70.00M | 1.03B | 1.91B | 79.00M | 0.00 | 1.00M | 0.00 | 0.00 | 0.00 | 0.00 | 0.00 | 0.00 | 0.00 | 0.00 | 0.00 | 41.00K | 0.00 | 152.30M | 155.90M | 128.30M | 136.40M | 153.20M | 152.70M | 112.80M |
| Operating Expenses | 10.06B | 10.83B | 4.23B | 3.03B | 2.42B | 2.02B | 1.68B | 1.31B | 1.57B | 2.06B | 1.88B | 2.99B | 2.47B | 2.12B | 1.54B | 4.19B | 5.13B | 2.42B | 2.16B | 1.74B | 1.44B | 1.49B | 1.27B | 1.24B | 1.18B | 987.08M | 868.59M | 765.50M | 782.57M | 639.26M | 553.66M | 650.40M | 614.60M | 560.20M | 559.10M | 585.70M | 603.70M | 418.90M |
| Cost & Expenses | 22.27B | 22.38B | 12.73B | 8.44B | 6.28B | 6.04B | 5.15B | 4.62B | 4.48B | 5.73B | 5.20B | 6.47B | 6.10B | 5.65B | 4.67B | 7.67B | 8.88B | 5.28B | 5.62B | 4.78B | 3.77B | 3.59B | 3.86B | 3.76B | 3.14B | 2.71B | 2.45B | 2.21B | 2.08B | 1.62B | 1.34B | 1.24B | 1.12B | 1.11B | 1.07B | 1.09B | 1.01B | 653.90M |
| Interest Income | 206.00M | 23.00M | 26.00M | 39.00M | 79.00M | 103.00M | 120.00M | 154.00M | 160.00M | 174.00M | 172.00M | 167.00M | 10.00M | 11.00M | 16.00M | 39.00M | 73.00M | 116.00M | 0.00 | 0.00 | 0.00 | 0.00 | 9.00K | 0.00 | 0.00 | 0.00 | 0.00 | 0.00 | 0.00 | 0.00 | 0.00 | 0.00 | 0.00 | 0.00 | 0.00 | 0.00 | 0.00 | 0.00 |
| Interest Expense | 106.00M | 88.00M | 34.00M | 47.00M | 94.00M | 121.00M | 126.00M | 156.00M | 160.00M | 177.00M | 177.00M | 175.00M | 180.00M | 199.00M | 438.00M | 2.13B | 2.11B | 941.00M | 182.50M | 134.73M | 8.97M | 694.19M | 195.40M | 0.00 | 0.00 | 43.70M | 0.00 | 0.00 | 0.00 | 112.17M | 0.00 | 0.00 | 0.00 | 0.00 | 0.00 | 0.00 | 43.40M | 6.40M |
| Depreciation & Amortization | 3.55B | 3.44B | 407.00M | 312.00M | 222.00M | 170.00M | 144.00M | 133.00M | 167.00M | 190.00M | 223.00M | 251.00M | 317.00M | 383.00M | 70.00M | 1.22B | 1.14B | 837.00M | 1.22B | 1.22B | 995.66M | 756.17M | 622.87M | 579.07M | 515.52M | 467.52M | 394.47M | 332.64M | 262.50M | 215.98M | 175.07M | 152.30M | 155.90M | 128.30M | 136.40M | 153.20M | 152.70M | 112.80M |
| EBITDA | 4.15B | 5.53B | 4.17B | 1.68B | 724.00M | 621.00M | 262.00M | -159.00M | -319.00M | -18.00M | 103.00M | -782.00M | 496.00M | 1.55B | 1.97B | -730.00M | -1.65B | 848.00M | 1.45B | 1.41B | 748.39M | -138.64M | 653.91M | 1.47B | 232.80M | 303.80M | 303.81M | 79.33M | 610.78M | 729.12M | 480.10M | 422.20M | 265.00M | 77.10M | 174.90M | 184.70M | 136.50M | 58.20M |
| EBITDA Ratio | 18.29% | 19.91% | 24.67% | 17.22% | 12.67% | 9.59% | 5.16% | -5.79% | -4.64% | 6.41% | 5.81% | 0.17% | 12.07% | 19.06% | 15.08% | 5.54% | -1.86% | 28.94% | 26.69% | 29.11% | 20.83% | 7.12% | 19.10% | 24.35% | -5.63% | 12.41% | 12.89% | 4.06% | 25.14% | 36.87% | 28.13% | 26.63% | 16.96% | 6.72% | 13.09% | 16.05% | 15.09% | 5.99% |
| Operating Income | 401.00M | 1.26B | 3.65B | 1.37B | 631.00M | 451.00M | 127.00M | -383.00M | -352.00M | 163.00M | 85.00M | -242.00M | 368.00M | 848.00M | 664.00M | -1.96B | -2.87B | -47.00M | 231.66M | 220.81M | -233.38M | -1.23B | -58.26M | 888.74M | -320.92M | -163.64M | -90.65M | -253.31M | 348.28M | 513.14M | 305.05M | 269.90M | 109.10M | -51.20M | 38.50M | 31.50M | -16.20M | -77.80M |
| Operating Income Ratio | 1.77% | 5.36% | 22.20% | 14.02% | 9.37% | 6.97% | 2.42% | -8.87% | -8.82% | 2.96% | 1.60% | -4.46% | 5.60% | 13.06% | 12.29% | -33.66% | -47.65% | -0.83% | 3.96% | 4.41% | -6.63% | -45.43% | -1.50% | 19.14% | -11.23% | -6.44% | -3.85% | -12.97% | 14.33% | 24.04% | 18.51% | 17.82% | 8.89% | -4.83% | 3.49% | 2.80% | -1.62% | -13.50% |
| Total Other Income/Expenses | 91.00M | -80.00M | 21.00M | -94.00M | -259.00M | -121.00M | -135.00M | -76.00M | -165.00M | -243.00M | -177.00M | -795.00M | -369.00M | 123.00M | -256.00M | -389.00M | -301.00M | -68.00M | -91.39M | -148.93M | -44.08M | -39.22M | -35.67M | 363.16M | 361.20M | -32.20M | -10.18M | 44.55M | 29.41M | -43.59M | 12.75M | 1.70M | -109.10M | 51.20M | 11.40M | -31.50M | -29.40M | 61.70M |
| Income Before Tax | 492.00M | 1.18B | 3.67B | 1.28B | 372.00M | 330.00M | -8.00M | -449.00M | -646.00M | -398.00M | -74.00M | -1.22B | -1.00M | 971.00M | 408.00M | -2.34B | -2.61B | -40.00M | 140.27M | 78.33M | -277.47M | -1.26B | -93.92M | 1.25B | 78.50M | -195.90M | -100.83M | -208.76M | 251.61M | 469.55M | 317.80M | 271.60M | 0.00 | 0.00 | 49.90M | 0.00 | -45.60M | 0.00 |
| Income Before Tax Ratio | 2.17% | 5.02% | 22.33% | 13.06% | 5.53% | 5.10% | -0.15% | -10.40% | -16.19% | -7.23% | -1.40% | -22.45% | -0.02% | 14.95% | 7.55% | -40.36% | -44.57% | -0.71% | 2.40% | 1.57% | -7.88% | -46.89% | -2.41% | 26.96% | 2.75% | -7.71% | -4.28% | -10.69% | 10.19% | 22.00% | 19.28% | 17.93% | 0.00% | 0.00% | 4.52% | 0.00% | -4.57% | 0.00% |
| Income Tax Expense | -346.00M | -122.00M | 513.00M | -1.21B | 31.00M | -9.00M | 18.00M | 39.00M | 14.00M | 5.00M | 9.00M | -34.00M | -4.00M | 38.00M | 112.00M | 68.00M | 27.00M | 23.00M | -6.64M | 5.84M | 2.94M | 44.59M | -14.46M | 256.87M | 167.40M | -91.90M | -55.16M | -85.01M | 70.21M | 153.70M | 89.00M | 26.60M | 0.00 | 0.00 | 3.80M | 0.00 | 2.50M | 0.00 |
| Net Income | 854.00M | 1.32B | 3.16B | 2.49B | 341.00M | 337.00M | -33.00M | -498.00M | -660.00M | -403.00M | -83.00M | -1.18B | 491.00M | 471.00M | 376.00M | -3.13B | -3.38B | -166.00M | 165.48M | 91.16M | -274.49M | -1.30B | -60.58M | 983.03M | -88.90M | -104.00M | -21.09M | -68.95M | 216.33M | 305.27M | 228.80M | 245.00M | 145.30M | -53.60M | 46.10M | 19.30M | -48.10M | -95.90M |
| Net Income Ratio | 3.77% | 5.59% | 19.24% | 25.50% | 5.07% | 5.20% | -0.63% | -11.53% | -16.54% | -7.32% | -1.57% | -21.82% | 7.48% | 7.25% | 6.96% | -53.34% | -56.19% | -2.94% | 2.83% | 1.82% | -7.80% | -48.31% | -1.56% | 21.17% | -3.11% | -4.09% | -0.90% | -3.53% | 12.37% | 14.30% | 13.88% | 16.18% | 11.85% | -5.06% | 4.17% | 1.71% | -4.82% | -6.35% |
| EPS | 0.53 | 0.85 | 2.61 | 2.10 | 0.31 | 0.34 | 0.04 | -0.60 | -0.84 | -0.53 | -0.11 | -1.60 | 0.68 | 0.66 | 0.46 | -5.15 | -6.06 | -0.34 | 0.41 | 0.25 | -0.79 | -3.81 | -0.18 | 3.18 | -0.30 | -0.36 | -0.08 | -0.26 | 0.80 | 1.51 | 0.88 | 1.29 | 0.77 | -0.39 | 0.22 | 0.06 | -0.36 | -0.83 |
| EPS Diluted | 0.53 | 0.84 | 2.57 | 2.06 | 0.30 | 0.32 | 0.04 | -0.60 | -0.84 | -0.53 | -0.11 | -1.60 | 0.66 | 0.64 | 0.45 | -5.15 | -6.06 | -0.34 | 0.40 | 0.25 | -0.79 | -3.81 | -0.18 | 2.89 | -0.30 | -0.36 | -0.08 | -0.26 | 0.79 | 1.46 | 0.82 | 1.25 | 0.76 | -0.39 | 0.22 | 0.06 | -0.36 | -0.83 |
| Weighted Avg Shares Out | 1.61B | 1.57B | 1.23B | 1.21B | 1.14B | 1.05B | 952.02M | 830.00M | 783.00M | 760.38M | 754.00M | 739.38M | 727.00M | 711.00M | 673.00M | 607.00M | 558.00M | 492.00M | 400.00M | 358.89M | 346.93M | 342.00M | 332.41M | 309.33M | 294.58M | 287.34M | 280.91M | 271.37M | 272.42M | 195.02M | 188.74M | 181.86M | 175.19M | 164.10M | 162.27M | 148.33M | 155.28M | 110.91M |
| Weighted Avg Shares Out (Dil) | 1.63B | 1.57B | 1.23B | 1.21B | 1.12B | 1.06B | 952.00M | 835.00M | 783.00M | 768.00M | 754.00M | 741.00M | 742.00M | 733.00M | 678.00M | 607.00M | 558.00M | 492.00M | 440.78M | 371.07M | 346.93M | 342.00M | 332.41M | 350.00M | 294.58M | 287.34M | 280.91M | 271.37M | 275.63M | 209.14M | 194.89M | 187.68M | 177.50M | 164.10M | 162.27M | 148.33M | 155.28M | 110.91M |
AMD Stock: I'm Buying This Dip
AMD: New Highs In 2025? Don't Be Surprised
US hits China with ‘groundbreaking and sweeping' microchip ban
World's Biggest Hedge Fund Sold Nvidia, Bought Super Micro, Palantir, and AMD
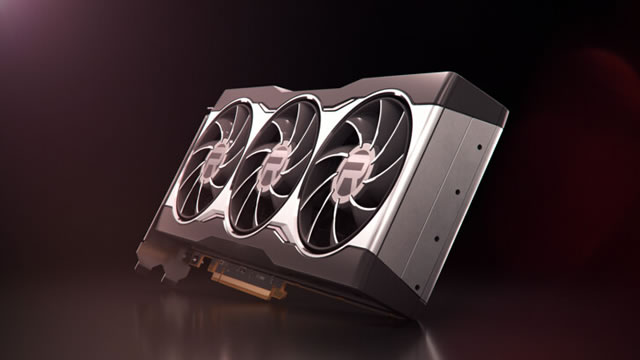
AMD stock price forecast: Here's why it could rebound soon

Cathie Wood Goes Bargain Hunting: 3 Stocks She Just Bought
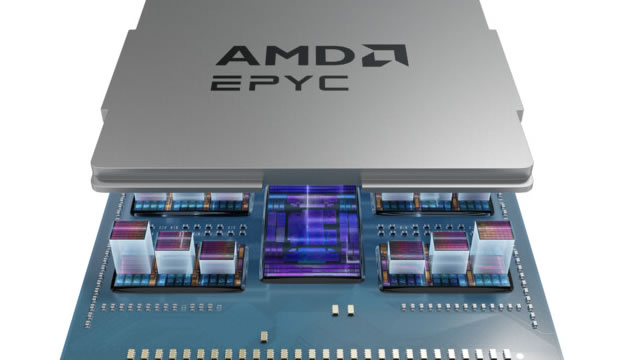
Billionaire Jeff Yass Increased Susquehanna's Position in Nvidia's Largest Competitor by 94%. Time to Buy?
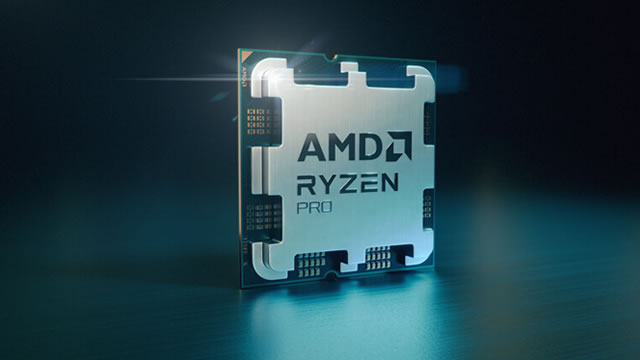
Why Is Advanced Micro (AMD) Down 8.3% Since Last Earnings Report?

Global chipmakers including Nvidia, AMD brace for tougher Chinese export controls

Is AMD Stock a Steal Right Now Under $140?
Source: https://incomestatements.info
Category: Stock Reports
