See more : Euro Sun Mining Inc. (CPNFF) Income Statement Analysis – Financial Results
Complete financial analysis of Amyris, Inc. (AMRS) income statement, including revenue, profit margins, EPS and key performance metrics. Get detailed insights into the financial performance of Amyris, Inc., a leading company in the Chemicals – Specialty industry within the Basic Materials sector.
- Shanghai Dazhong Public Utilities(Group) Co.,Ltd. (600635.SS) Income Statement Analysis – Financial Results
- Banco BBVA Argentina S.A. (BBAR.BA) Income Statement Analysis – Financial Results
- Kudelski SA (KUD.SW) Income Statement Analysis – Financial Results
- Rex Resources Corp. (OWN.V) Income Statement Analysis – Financial Results
- Synchrony Financial (0LC3.L) Income Statement Analysis – Financial Results
Amyris, Inc. (AMRS)
About Amyris, Inc.
Amyris, Inc., a synthetic biotechnology company, operates in the clean health and beauty, and flavors and fragrance markets in Europe, North America, Asia, and South America. The company manufactures and sells clean beauty, personal care, and health and wellness consumer products, as well as ingredients to the flavor and fragrance, nutrition, food and beverage, and clean beauty and personal care end markets. It offers its products under the Biossance, Pipette, Purecane, Terasana, Costa Brazil, OLIKA, Rose Inc., and JVN brand names. The company has a collaboration agreement with the Infectious Disease Research Institute for the development of a COVID-19 vaccine. The company was formerly known as Amyris Biotechnologies, Inc. and changed its name to Amyris, Inc. in June 2010. Amyris, Inc. was incorporated in 2003 and is headquartered in Emeryville, California.
| Metric | 2022 | 2021 | 2020 | 2019 | 2018 | 2017 | 2016 | 2015 | 2014 | 2013 | 2012 | 2011 | 2010 | 2009 | 2008 |
|---|---|---|---|---|---|---|---|---|---|---|---|---|---|---|---|
| Revenue | 269.85M | 341.82M | 173.14M | 152.56M | 80.42M | 143.45M | 77.19M | 34.15M | 43.27M | 41.12M | 73.69M | 146.99M | 80.31M | 64.61M | 13.89M |
| Cost of Revenue | 258.67M | 155.14M | 87.81M | 76.19M | 38.91M | 63.83M | 56.68M | 37.37M | 33.20M | 38.25M | 77.31M | 155.62M | 70.52M | 60.43M | 10.36M |
| Gross Profit | 11.18M | 186.68M | 85.33M | 76.37M | 41.51M | 79.62M | 20.51M | -3.22M | 10.07M | 2.87M | -3.62M | -8.62M | 9.80M | 4.18M | 3.53M |
| Gross Profit Ratio | 4.14% | 54.61% | 49.28% | 50.06% | 51.62% | 55.50% | 26.58% | -9.43% | 23.27% | 6.97% | -4.91% | -5.87% | 12.20% | 6.47% | 25.40% |
| Research & Development | 110.22M | 94.29M | 71.68M | 71.46M | 68.69M | 56.84M | 51.41M | 44.64M | 49.66M | 56.07M | 73.63M | 87.32M | 55.25M | 38.26M | 30.31M |
| General & Administrative | 0.00 | 0.00 | 0.00 | 0.00 | 0.00 | 0.00 | 0.00 | 0.00 | 0.00 | 0.00 | 0.00 | 0.00 | 0.00 | 0.00 | 0.00 |
| Selling & Marketing | 0.00 | 0.00 | 0.00 | 0.00 | 0.00 | 0.00 | 0.00 | 0.00 | 0.00 | 0.00 | 0.00 | 0.00 | 0.00 | 0.00 | 0.00 |
| SG&A | 493.63M | 257.81M | 137.07M | 126.59M | 86.92M | 63.03M | 47.72M | 56.26M | 55.44M | 57.05M | 78.72M | 83.23M | 40.39M | 23.56M | 16.62M |
| Other Expenses | 0.00 | -38.07M | -89.16M | -20.15M | 1.36M | -956.00K | -45.37M | -114.18M | -30.00M | -20.86M | -45.63M | 0.00 | 0.00 | 0.00 | 0.00 |
| Operating Expenses | 603.84M | 352.10M | 208.75M | 198.05M | 155.61M | 119.88M | 99.13M | 105.62M | 105.10M | 113.12M | 152.35M | 170.55M | 95.64M | 61.82M | 46.93M |
| Cost & Expenses | 862.51M | 507.24M | 296.56M | 274.23M | 194.52M | 183.71M | 155.81M | 143.00M | 138.30M | 151.37M | 229.66M | 326.16M | 166.16M | 122.25M | 57.29M |
| Interest Income | 0.00 | 0.00 | 0.00 | 0.00 | 0.00 | 0.00 | 258.00K | 264.00K | 387.00K | 162.00K | 1.47M | 1.54M | 1.54M | 448.00K | 1.38M |
| Interest Expense | 24.73M | 25.61M | 47.95M | 58.67M | 39.27M | 36.16M | 37.63M | 78.85M | 28.95M | 9.11M | 4.93M | 1.54M | 1.44M | 1.22M | 377.00K |
| Depreciation & Amortization | 27.27M | -25.38M | -77.04M | -20.15M | 4.92M | 11.36M | 11.37M | 12.92M | 14.97M | 16.64M | 14.57M | 11.08M | 7.28M | 5.78M | 2.63M |
| EBITDA | -514.21M | -190.80M | -200.46M | -141.83M | -112.74M | -41.22M | -115.83M | -118.46M | -225.62M | -5.61M | -200.13M | -166.55M | -81.53M | -51.42M | -39.40M |
| EBITDA Ratio | -190.55% | -55.82% | -115.78% | -92.97% | -140.19% | -28.73% | -150.05% | -346.86% | -521.36% | -13.64% | -271.56% | -113.31% | -101.51% | -79.58% | -283.58% |
| Operating Income | -592.67M | -165.42M | -123.42M | -121.67M | -120.95M | -40.26M | -85.92M | -148.53M | -99.83M | -119.62M | -201.82M | -179.17M | -83.79M | -63.41M | -43.40M |
| Operating Income Ratio | -219.63% | -48.39% | -71.29% | -79.76% | -150.40% | -28.07% | -111.31% | -434.90% | -230.69% | -290.90% | -273.86% | -121.89% | -104.33% | -98.14% | -312.41% |
| Total Other Income/Expenses | 54.04M | -106.89M | -200.43M | -120.46M | -28.16M | -36.84M | -10.86M | -69.05M | 102.49M | -116.14M | -3.23M | 213.00K | 2.96M | -1.39M | 857.00K |
| Income Before Tax | -538.63M | -272.31M | -323.85M | -242.14M | -211.35M | -77.10M | -86.78M | -217.58M | 2.66M | -235.75M | -205.05M | -178.96M | -80.83M | -64.80M | -42.54M |
| Income Before Tax Ratio | -199.60% | -79.67% | -187.05% | -158.72% | -262.81% | -53.75% | -112.42% | -637.09% | 6.15% | -573.35% | -278.25% | -121.75% | -100.64% | -100.30% | -306.24% |
| Income Tax Expense | -2.70M | -8.11M | 293.00K | 629.00K | -50.95M | 295.00K | 553.00K | 468.00K | 495.00K | -847.00K | 981.00K | 552.00K | -3.98M | 877.00K | -207.00K |
| Net Income | -535.93M | -264.20M | -324.14M | -242.77M | -211.35M | -77.39M | -87.33M | -217.95M | 2.29M | -235.11M | -205.14M | -178.87M | -81.87M | -64.46M | -41.86M |
| Net Income Ratio | -198.60% | -77.29% | -187.22% | -159.13% | -262.81% | -53.95% | -113.14% | -638.16% | 5.28% | -571.78% | -278.37% | -121.69% | -101.94% | -99.77% | -301.35% |
| EPS | -1.58 | -0.90 | -1.59 | -2.39 | -3.50 | -2.40 | -5.49 | -25.75 | 0.45 | -46.73 | -54.25 | -59.89 | -82.75 | -203.42 | -124.74 |
| EPS Diluted | -1.58 | -0.90 | -1.59 | -2.39 | -3.50 | -2.40 | -4.95 | -25.75 | 0.28 | -46.73 | -54.25 | -59.89 | -82.75 | -203.42 | -124.74 |
| Weighted Avg Shares Out | 339.33M | 292.34M | 203.60M | 101.37M | 60.36M | 32.25M | 15.90M | 8.46M | 5.23M | 5.03M | 3.78M | 2.99M | 989.36K | 316.87K | 335.61K |
| Weighted Avg Shares Out (Dil) | 339.33M | 292.67M | 203.60M | 101.37M | 60.36M | 32.25M | 17.64M | 8.46M | 8.12M | 5.03M | 3.78M | 2.99M | 989.36K | 316.87K | 335.61K |

MiR Features Latest Innovations in Autonomous Mobile Robots at Automate 2023
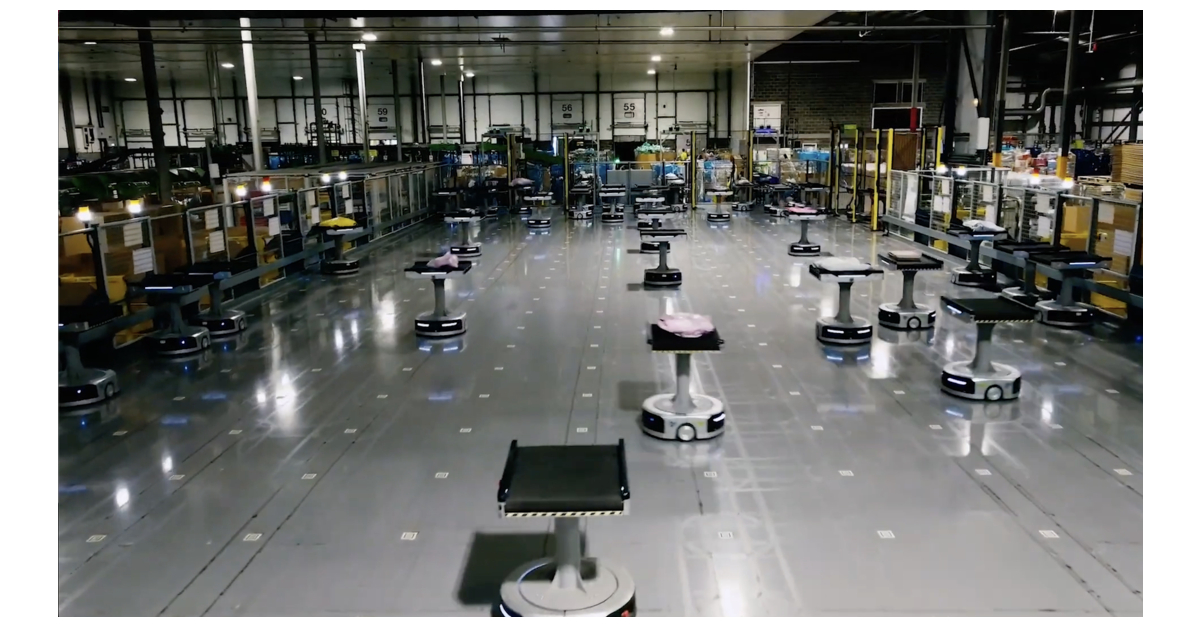
OSARO and Geek+ Partner to Integrate Robotic Warehouse Solutions

Zebra Technologies’ James Lawton and John Wirthlin Named Supply Chain Pros to Know
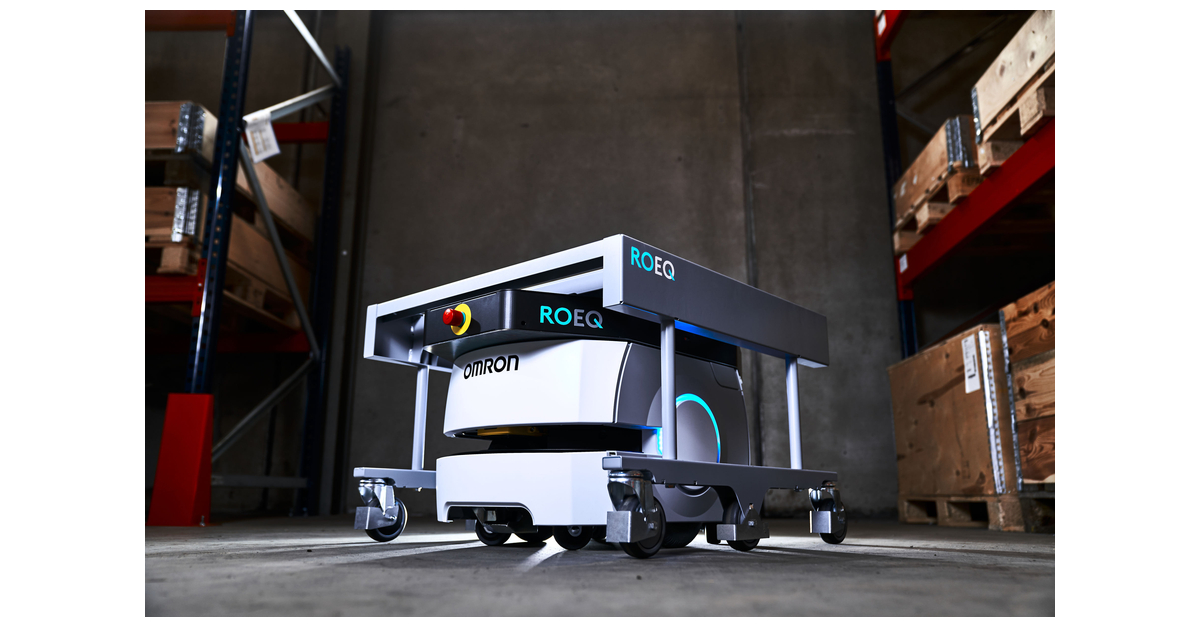
CORRECTING and REPLACING ROEQ Debuts Safe, Reliable Cart System for OMRON LD-90x Autonomous Mobile Robot, Supporting Payload Up to 130KG

MiR Appoints New President, Extends Successful Strategy for Global Growth
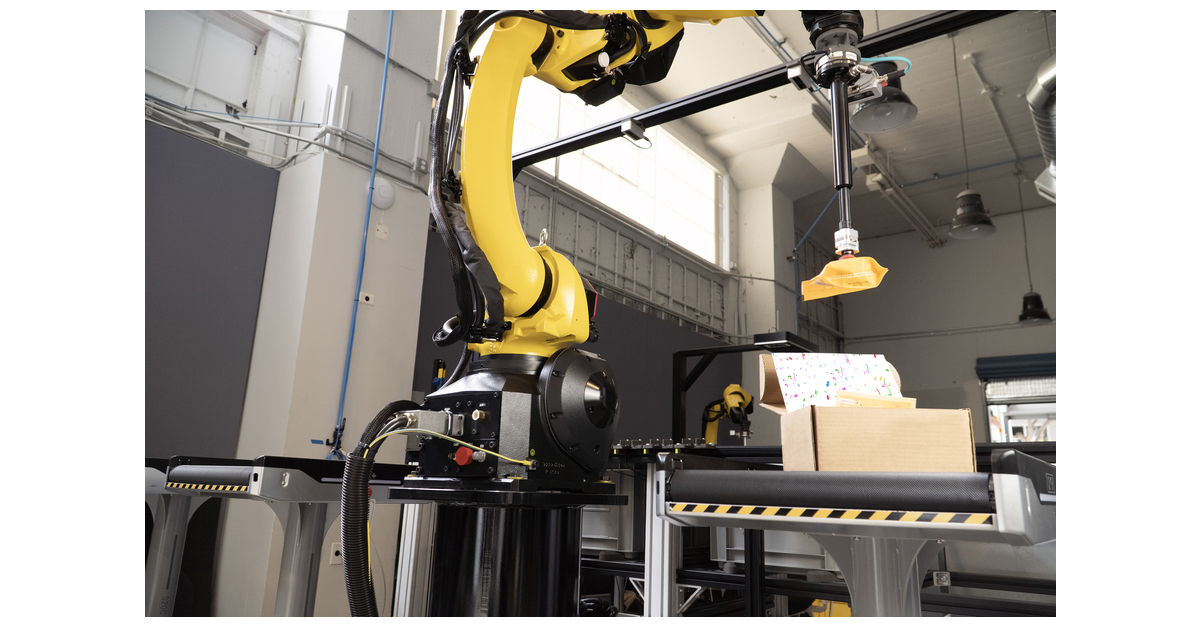
OSARO Targets Fast-Growing Subscription Market with AI-Powered Kitting Robots
OTTO Motors Makes Major Strides for Interoperability Standard VDA5050

Top 5 Materials Stocks That May Explode In May - Amyris (NASDAQ:AMRS), MP Materials (NYSE:MP)

5 Top Penny Stocks To Buy According To Analysts, Targets Up To 165%

3 Biotech Stocks to Sell Before They're 6 Feet Under
Source: https://incomestatements.info
Category: Stock Reports
