See more : Al-Omran Industrial Trading Company (4141.SR) Income Statement Analysis – Financial Results
Complete financial analysis of Anghami Inc. (ANGH) income statement, including revenue, profit margins, EPS and key performance metrics. Get detailed insights into the financial performance of Anghami Inc., a leading company in the Entertainment industry within the Communication Services sector.
- Mantaro Precious Metals Corp. (MSLVF) Income Statement Analysis – Financial Results
- Freeline Therapeutics Holdings plc (FRLN) Income Statement Analysis – Financial Results
- Fincantieri S.p.A. (FNCNF) Income Statement Analysis – Financial Results
- Micronics Japan Co., Ltd. (6871.T) Income Statement Analysis – Financial Results
- MGI Digital Technology Société Anonyme (FRIIF) Income Statement Analysis – Financial Results
Anghami Inc. (ANGH)
About Anghami Inc.
Anghami Inc. operates a digital music entertainment technology platform in the Middle East and North Africa. It offers a music application and platform that provides Arabic and international music to stream and download. The company was founded in 2012 and is based in Abu Dhabi, the United Arab Emirates.
| Metric | 2023 | 2022 | 2021 | 2020 | 2019 |
|---|---|---|---|---|---|
| Revenue | 41.38M | 48.48M | 35.50M | 30.52M | 31.23M |
| Cost of Revenue | 31.09M | 39.13M | 26.46M | 22.35M | 21.32M |
| Gross Profit | 10.29M | 9.35M | 9.04M | 8.17M | 9.91M |
| Gross Profit Ratio | 24.87% | 19.29% | 25.47% | 26.78% | 31.72% |
| Research & Development | 0.00 | 725.58K | 619.26K | 0.00 | 0.00 |
| General & Administrative | 16.11M | 18.39M | 16.34M | 5.17M | 6.63M |
| Selling & Marketing | 8.37M | 11.57M | 8.01M | 5.28M | 8.23M |
| SG&A | 24.48M | 29.96M | 24.36M | 10.45M | 14.86M |
| Other Expenses | 366.00K | -6.05M | -1.75M | 269.50K | 297.33K |
| Operating Expenses | 24.85M | 23.91M | 22.61M | 10.72M | 15.16M |
| Cost & Expenses | 55.94M | 63.04M | 49.07M | 33.07M | 36.48M |
| Interest Income | 18.96K | 15.04K | 145.11K | 137.40K | 3.31K |
| Interest Expense | 268.52K | 552.75K | 2.23M | 323.13K | 166.40K |
| Depreciation & Amortization | 3.22M | 3.79M | 952.55K | 859.13K | 668.62K |
| EBITDA | -11.52M | -55.98M | -14.08M | -2.93M | -4.66M |
| EBITDA Ratio | -27.85% | -22.65% | -36.54% | -9.61% | -16.99% |
| Operating Income | -14.56M | -14.55M | -13.56M | -2.55M | -5.25M |
| Operating Income Ratio | -35.18% | -30.02% | -38.20% | -8.35% | -16.81% |
| Total Other Income/Expenses | -452.84K | -42.95M | -4.15M | -2.69M | -1.06M |
| Income Before Tax | -15.01M | -60.33M | -17.71M | -5.24M | -6.31M |
| Income Before Tax Ratio | -36.27% | -124.43% | -49.88% | -17.18% | -20.20% |
| Income Tax Expense | 654.99K | 892.94K | 340.00K | 501.24K | 638.97K |
| Net Income | -15.81M | -61.22M | -18.05M | -5.74M | -6.95M |
| Net Income Ratio | -38.21% | -126.28% | -50.84% | -18.82% | -22.24% |
| EPS | -0.60 | -2.35 | -0.70 | -0.22 | -0.27 |
| EPS Diluted | -0.60 | -2.35 | -0.70 | -0.22 | -0.27 |
| Weighted Avg Shares Out | 26.43M | 26.01M | 25.77M | 25.77M | 25.77M |
| Weighted Avg Shares Out (Dil) | 26.43M | 26.01M | 25.77M | 25.77M | 25.77M |

SRMG Ventures Announces Strategic Investment in Anghami, MENA's Leading Music and Entertainment Streaming Platform

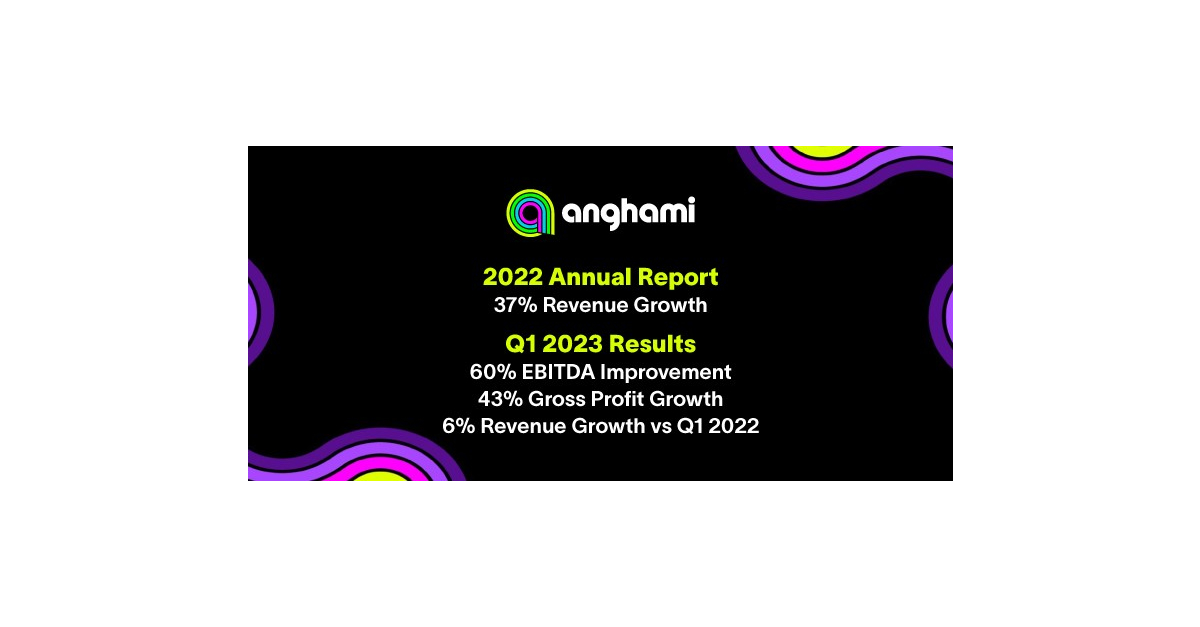
Anghami Files 2022 Annual Report With 37% Revenue Growth & Announces Q1 2023 Results With 60% Improvement in EBITDA

Anghami Reports 35.6% Revenue Growth in Preliminary Unaudited 2022 Results, with Focus on Continued Efficiency and Profitability for 2023

Anghami Lab Opens in Boulevard Riyadh City, Bringing a Whole New Experience to the City’s Buzzing Music and Social Scene

Anghami Reports Preliminary Q3 2022 Unaudited Results With 29% Y-O-Y Revenue Growth and Gross Profit Increase

Anghami Reports Strong Preliminary H1 2022 Results With 29% Y-O-Y Revenue and 41% Y-O-Y Monthly Subscriber Growth

Anghami Acquires Live Events and Concerts Company Spotlight, as It Expands Into Offline and Virtual Entertainment

A Decade of Partnership Renewed as MBC GROUP and Anghami Renew Their Marketing Agreement

Anghami, Volkswagen Partner to Promote Safer Driving

Anghami Reports Full Year 2021 Financial Results With Total Revenue of $35.5 Mn, Up 16% Year-Over-Year, and Preliminary Q1 2022 Revenue of $9.3 Mn Up 23%
Source: https://incomestatements.info
Category: Stock Reports
