See more : Fujian Sanmu Group Co., Ltd. (000632.SZ) Income Statement Analysis – Financial Results
Complete financial analysis of Algonquin Power & Utilities Cor (AQNA) income statement, including revenue, profit margins, EPS and key performance metrics. Get detailed insights into the financial performance of Algonquin Power & Utilities Cor, a leading company in the industry within the sector.
- Cincon Electronics Co., Ltd. (3332.TWO) Income Statement Analysis – Financial Results
- Drive Shack Inc. (DS-PB) Income Statement Analysis – Financial Results
- The Growth for Good Acquisition Corporation (GFGD) Income Statement Analysis – Financial Results
- RAVENO Capital AG (TUF.DE) Income Statement Analysis – Financial Results
- Teradyne, Inc. (0LEF.L) Income Statement Analysis – Financial Results
Algonquin Power & Utilities Cor (AQNA)
Industry: Diversified Utilities
Sector: Utilities
About Algonquin Power & Utilities Cor
Algonquin Power & Utilities Corp. operates in the power and utility industries in the United States, Canada, and other regions. The company operates in two segments, Regulated Services Group and Renewable Energy Group. The company primarily owns and operates a regulated electric, water distribution and wastewater collection, and natural gas utility systems and transmission operations. As of December 31, 2023, it provided distribution services to approximately 1,256,000 customer connections in the electric (approximately 309,000 customer connections), water and wastewater (approximately 572,000 customer connections), and natural gas sectors (approximately 375,000 customer connections). The company’s electrical distribution utility systems and related transmission and generation assets are located in the states of Arkansas, California, Kansas, Missouri, Nevada, New Hampshire, and Oklahoma, and in Bermuda. Its regulated water distribution and wastewater collection utility systems are located in the states of Arizona, Arkansas, California, Illinois, Missouri, New York and Texas, and in Chile. The company’s regulated natural gas distribution utility systems located in the province of New Brunswick and the states of Georgia, Illinois, Iowa, Massachusetts, Missouri, New Hampshire and New York. It also owns and operates generating assets with a gross capacity of approximately 2.0 gigawatt (GW) and has investments in generating assets with approximately 0.3 GW of net generation capacity. The company generates and sells electrical energy, capacity, ancillary products, and renewable attributes produced by its renewable and clean power generation facilities. It has economic interests in hydroelectric, wind, solar, renewable natural gas, and thermal facilities. As of December 31, 2023, it had a combined net generating capacity attributable to the Renewable Energy Group of approximately 2.7 GW. The company was incorporated in 1988 and is headquartered in Oakville, Canada.
| Metric | 2022 | 2021 | 2020 | 2019 | 2018 | 2017 | 2016 | 2015 | 2014 | 2013 | 2012 |
|---|---|---|---|---|---|---|---|---|---|---|---|
| Revenue | 2.77B | 2.27B | 1.68B | 1.63B | 1.65B | 1.52B | 816.21M | 740.81M | 813.09M | 635.65M | 349.94M |
| Cost of Revenue | 1.72B | 1.42B | 917.83M | 915.29M | 956.60M | 843.46M | 467.91M | 473.00M | 565.53M | 425.79M | 238.86M |
| Gross Profit | 1.05B | 858.10M | 759.16M | 711.10M | 691.86M | 678.48M | 348.30M | 267.81M | 247.56M | 209.86M | 111.08M |
| Gross Profit Ratio | 37.87% | 37.73% | 45.27% | 43.72% | 41.97% | 44.58% | 42.67% | 36.15% | 30.45% | 33.02% | 31.74% |
| Research & Development | 0.00 | 0.00 | 0.00 | 0.00 | 0.00 | 0.00 | 0.00 | 0.00 | 0.00 | 0.00 | 0.00 |
| General & Administrative | 80.23M | 66.73M | 63.12M | 56.80M | 52.71M | 49.64M | 34.52M | 28.71M | 29.96M | 22.14M | 19.64M |
| Selling & Marketing | 21.90M | 32.63M | 40.78M | 17.33M | 4.99M | 9.04M | 0.00 | 0.00 | 0.00 | 0.00 | 0.00 |
| SG&A | 102.13M | 99.35M | 103.91M | 74.13M | 57.70M | 58.68M | 34.52M | 28.71M | 29.96M | 22.14M | 19.64M |
| Other Expenses | 0.00 | 0.00 | 0.00 | 0.00 | 0.00 | 0.00 | 0.00 | 0.00 | 0.00 | 0.00 | 0.00 |
| Operating Expenses | 1.14B | 506.31M | 215.18M | 25.46M | 407.28M | 351.83M | 159.66M | 131.09M | 136.01M | 107.73M | 75.04M |
| Cost & Expenses | 2.86B | 1.92B | 1.13B | 940.75M | 1.36B | 1.20B | 627.57M | 604.09M | 701.54M | 533.52M | 313.90M |
| Interest Income | 278.57M | 209.55M | 181.93M | 181.49M | 152.12M | 151.52M | 92.19M | 42.84M | 48.99M | 45.04M | 29.48M |
| Interest Expense | 0.00 | 0.00 | 0.00 | 0.00 | 0.00 | 0.00 | 0.00 | 0.00 | 0.00 | 0.00 | 0.00 |
| Depreciation & Amortization | 455.52M | 402.96M | 314.12M | 284.30M | 260.77M | 256.78M | 145.78M | 109.28M | 99.65M | 93.25M | 51.68M |
| EBITDA | 945.04M | 758.75M | 655.26M | 636.97M | 634.16M | 625.27M | 320.37M | 240.41M | 218.77M | 190.60M | 93.63M |
| EBITDA Ratio | 34.18% | 33.36% | 39.07% | 39.16% | 38.47% | 41.08% | 39.25% | 32.45% | 26.91% | 29.98% | 26.76% |
| Operating Income | 489.52M | 355.78M | 341.14M | 352.66M | 373.39M | 368.49M | 174.60M | 131.13M | 119.12M | 97.34M | 41.95M |
| Operating Income Ratio | 17.70% | 15.64% | 20.34% | 21.68% | 22.65% | 24.21% | 21.39% | 17.70% | 14.65% | 15.31% | 11.99% |
| Total Other Income/Expenses | -859.19M | -213.55M | 451.28M | 202.41M | -240.93M | -193.36M | -78.15M | -37.26M | -56.56M | -40.25M | -35.39M |
| Income Before Tax | -369.67M | 142.23M | 792.41M | 555.07M | 132.46M | 175.13M | 96.45M | 93.87M | 62.56M | 57.09M | 6.56M |
| Income Before Tax Ratio | -13.37% | 6.25% | 47.25% | 34.13% | 8.04% | 11.51% | 11.82% | 12.67% | 7.69% | 8.98% | 1.87% |
| Income Tax Expense | 61.51M | 43.43M | 64.58M | 70.12M | 53.37M | 73.43M | 27.66M | 31.51M | 14.51M | 8.62M | 14.41M |
| Net Income | -220.71M | 255.86M | 774.06M | 522.40M | 176.96M | 93.69M | 61.05M | 54.87M | 39.84M | 43.39M | 20.20M |
| Net Income Ratio | -7.98% | 11.25% | 46.16% | 32.12% | 10.73% | 6.16% | 7.48% | 7.41% | 4.90% | 6.83% | 5.77% |
| EPS | -0.33 | 0.41 | 1.37 | 1.04 | 0.38 | 0.24 | 0.22 | 0.21 | 0.18 | 0.21 | 0.13 |
| EPS Diluted | -0.33 | 0.41 | 1.37 | 1.03 | 0.38 | 0.24 | 0.22 | 0.21 | 0.18 | 0.21 | 0.13 |
| Weighted Avg Shares Out | 668.82M | 624.04M | 564.37M | 502.31M | 465.69M | 385.99M | 274.08M | 256.52M | 216.34M | 205.83M | 158.91M |
| Weighted Avg Shares Out (Dil) | 677.86M | 628.95M | 565.01M | 504.74M | 466.05M | 385.99M | 274.08M | 256.52M | 216.34M | 205.83M | 158.91M |
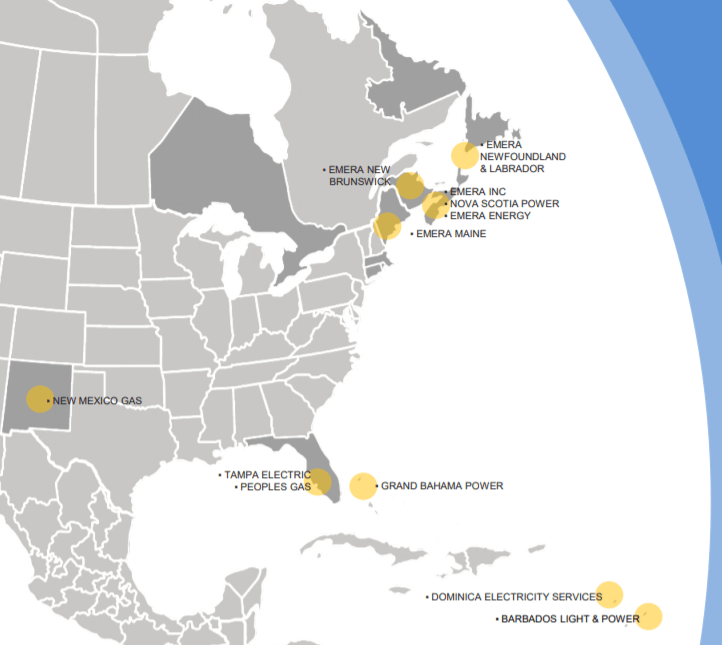
Emera: This Dividend Grower Has A Sunny Future

Canadian All-Star Stocks: Dividend Increases - Week Of Sept. 7
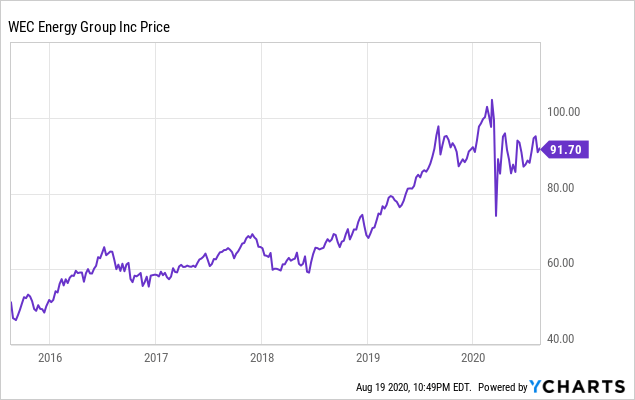
WEC Energy's Business Is Resilient Even In The Midst Of A Challenging Environment
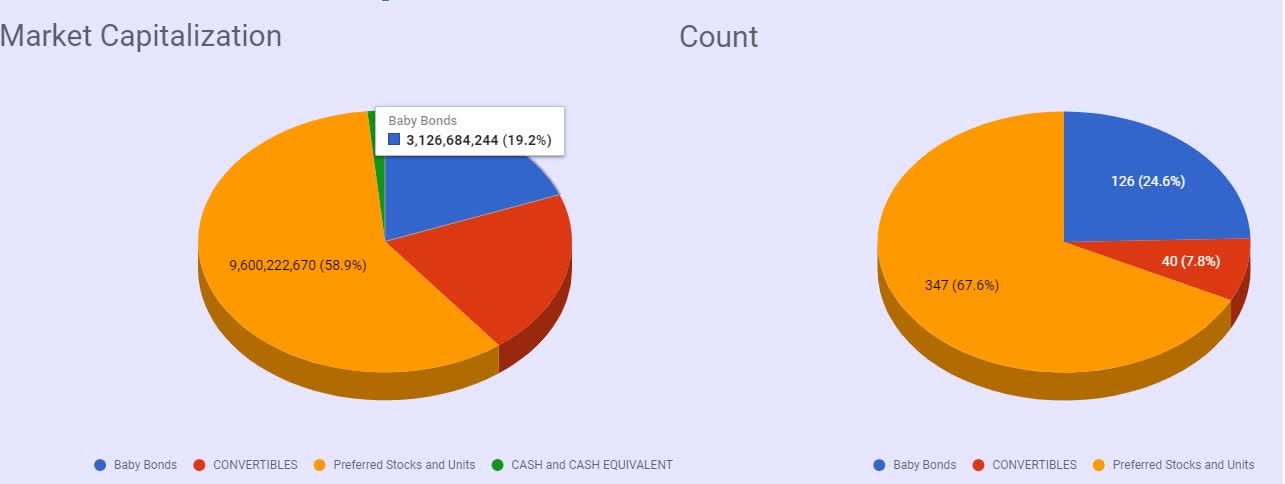
Baby Bonds Complete Review
Algonquin Power & Utilities Corp. 2020 Q2 - Results - Earnings Call Presentation

Algonquin Power & Utilities Corp. (AQN) CEO Arun Banskota on Q2 2020 Results - Earnings Call Transcript
Baby Bonds Complete Review
Algonquin: Outlook Remains Favorable With Its U.S.$9.2 Billion Capital Projects

15 Kiplinger 'Global Aristocrats' Are Spot On For July
Baby Bonds Complete Review
Source: https://incomestatements.info
Category: Stock Reports
