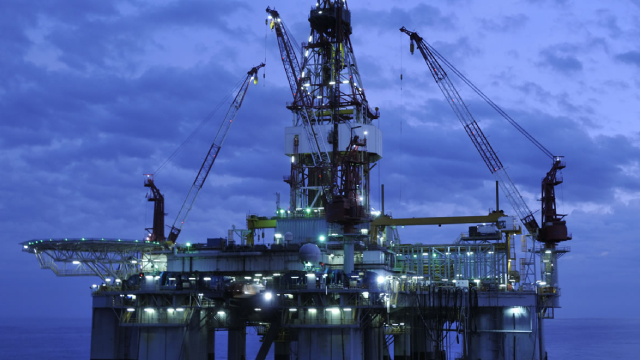
Complete financial analysis of Antero Resources Corporation (AR) income statement, including revenue, profit margins, EPS and key performance metrics. Get detailed insights into the financial performance of Antero Resources Corporation, a leading company in the Oil & Gas Exploration & Production industry within the Energy sector.
- SoftwareONE Holding AG (SWONF) Income Statement Analysis – Financial Results
- Topindo Solusi Komunika Tbk. (TOSK.JK) Income Statement Analysis – Financial Results
- Telkonet, Inc. (TKOI) Income Statement Analysis – Financial Results
- Sernova Corp. (SEOVF) Income Statement Analysis – Financial Results
- Hostmore plc (MORRF) Income Statement Analysis – Financial Results
Antero Resources Corporation (AR)
About Antero Resources Corporation
Antero Resources Corporation, an independent oil and natural gas company, acquires, explores for, develops, and produces natural gas, natural gas liquids, and oil properties in the United States. As of December 31, 2021, it had approximately 502,000 net acres in the Appalachian Basin; and 174,000 net acres in the Upper Devonian Shale. The company also owned and operated 494 miles of gas gathering pipelines in the Appalachian Basin; and 21 compressor stations. It had estimated proved reserves of 17.7 trillion cubic feet of natural gas equivalent, including 10.2 trillion cubic feet of natural gas; 718 million barrels of assumed recovered ethane; 501 million barrels of primarily propane, isobutane, normal butane, and natural gasoline; and 36 million barrels of oil. The company was formerly known as Antero Resources Appalachian Corporation and changed its name to Antero Resources Corporation in June 2013. Antero Resources Corporation was founded in 2002 and is headquartered in Denver, Colorado.
| Metric | 2023 | 2022 | 2021 | 2020 | 2019 | 2018 | 2017 | 2016 | 2015 | 2014 | 2013 | 2012 | 2011 | 2010 |
|---|---|---|---|---|---|---|---|---|---|---|---|---|---|---|
| Revenue | 4.68B | 8.29B | 5.79B | 3.08B | 3.65B | 3.65B | 2.75B | 1.77B | 1.40B | 1.76B | 821.45M | 264.98M | 195.29M | 47.43M |
| Cost of Revenue | 3.61B | 3.67B | 3.54B | 3.60B | 3.33B | 2.57B | 2.10B | 1.81B | 1.48B | 1.06B | 512.22M | 219.57M | 109.55M | 31.80M |
| Gross Profit | 1.07B | 4.62B | 2.25B | -514.44M | 315.98M | 1.08B | 644.09M | -41.37M | -86.33M | 702.26M | 309.22M | 45.41M | 85.74M | 15.63M |
| Gross Profit Ratio | 22.90% | 55.72% | 38.94% | -16.68% | 8.66% | 29.52% | 23.44% | -2.34% | -6.18% | 39.93% | 37.64% | 17.14% | 43.90% | 32.95% |
| Research & Development | 0.00 | 0.00 | 0.00 | 0.00 | 0.00 | 0.00 | 0.00 | 0.00 | 0.00 | 0.00 | 0.00 | 0.00 | 0.00 | 0.00 |
| General & Administrative | 224.52M | 172.91M | 145.01M | 134.48M | 178.70M | 240.34M | 251.20M | 239.32M | 233.70M | 216.53M | 425.44M | 45.28M | 33.34M | 21.95M |
| Selling & Marketing | 284.97M | 531.30M | 811.70M | 469.40M | 549.81M | 686.06M | 366.28M | 499.34M | 299.06M | 103.44M | 0.00 | 0.00 | 0.00 | 0.00 |
| SG&A | 509.48M | 704.21M | 956.70M | 603.89M | 728.51M | 926.40M | 617.48M | 738.67M | 532.76M | 319.97M | 425.44M | 45.28M | 33.34M | 21.95M |
| Other Expenses | 0.00 | -447.49M | -754.80M | -323.37M | -291.72M | -451.12M | -246.90M | -383.71M | -170.73M | -24.44M | 23.34M | 14.78M | 4.11M | 2.36M |
| Operating Expenses | 216.22M | 256.73M | 201.91M | 280.51M | 436.79M | 475.28M | 370.58M | 354.95M | 362.03M | 295.53M | 448.78M | 60.06M | 37.45M | 24.31M |
| Cost & Expenses | 3.83B | 3.93B | 3.74B | 3.88B | 3.77B | 3.05B | 2.47B | 2.16B | 1.85B | 1.35B | 961.00M | 279.63M | 147.01M | 56.12M |
| Interest Income | 0.00 | 125.37M | 181.87M | 199.87M | 228.11M | 0.00 | 0.00 | 0.00 | 0.00 | 0.00 | 0.00 | 0.00 | 0.00 | 0.00 |
| Interest Expense | 117.87M | 125.37M | 181.87M | 199.87M | 228.11M | 286.74M | 268.70M | 253.55M | 234.40M | 160.05M | 136.62M | 97.51M | 74.40M | 56.46M |
| Depreciation & Amortization | 693.21M | 685.23M | 745.83M | 865.29M | 918.63M | 975.28M | 986.82M | 975.28M | 711.42M | 479.17M | 234.94M | 102.13M | 55.79M | 18.53M |
| EBITDA | 1.23B | 3.29B | 699.51M | -592.73M | 779.49M | 1.09B | 1.75B | -16.99M | 2.61B | 1.76B | 533.58M | 87.48M | 586.61M | 76.15M |
| EBITDA Ratio | 26.25% | 61.76% | 48.73% | 0.01% | 21.37% | 44.31% | 40.79% | 23.56% | 18.83% | 50.37% | 11.61% | 33.01% | 53.29% | 20.76% |
| Operating Income | 453.13M | 4.44B | 2.08B | -864.86M | -139.03M | 71.91M | 740.09M | -975.80M | 1.79B | 1.30B | 341.21M | 444.02M | 530.98M | 60.30M |
| Operating Income Ratio | 9.68% | 53.49% | 35.85% | -28.04% | -3.81% | 1.97% | 26.93% | -55.19% | 128.14% | 73.90% | 41.54% | 167.56% | 271.90% | 127.12% |
| Total Other Income/Expenses | -35.29M | -99.24M | -252.05M | -704.45M | 619.80M | -246.46M | -250.01M | -270.02M | -234.40M | -180.44M | -179.18M | 193.68M | 408.20M | -59.14M |
| Income Before Tax | 417.84M | 2.47B | -228.19M | -1.66B | -367.25M | -174.56M | 490.09M | -1.25B | 1.56B | 1.12B | 162.02M | 346.51M | 456.49M | 1.16M |
| Income Before Tax Ratio | 8.92% | 29.83% | -3.94% | -53.76% | -10.07% | -4.78% | 17.83% | -70.46% | 111.36% | 63.64% | 19.72% | 130.77% | 233.75% | 2.44% |
| Income Tax Expense | 75.99M | 448.69M | -74.08M | -397.48M | -74.11M | -128.86M | -295.05M | -496.38M | 575.89M | 445.67M | 186.21M | 121.23M | 185.30M | 939.00K |
| Net Income | 242.92M | 1.90B | -154.11M | -1.26B | -293.14M | -397.52M | 615.07M | -848.82M | 941.36M | 673.59M | -18.93M | -285.07M | 392.68M | 228.63M |
| Net Income Ratio | 5.19% | 22.89% | -2.66% | -40.87% | -8.03% | -10.88% | 22.38% | -48.01% | 67.38% | 38.30% | -2.30% | -107.58% | 201.08% | 482.02% |
| EPS | 0.81 | 6.18 | -0.50 | -4.63 | -0.96 | -1.26 | 1.95 | -2.88 | 3.43 | 2.57 | -0.07 | -1.10 | 1.51 | 0.88 |
| EPS Diluted | 0.78 | 5.77 | -0.50 | -4.63 | -0.96 | -1.26 | 1.94 | -2.88 | 3.43 | 2.57 | -0.07 | -1.10 | 1.51 | 0.88 |
| Weighted Avg Shares Out | 299.79M | 307.20M | 308.15M | 272.43M | 306.40M | 315.49M | 315.43M | 294.73M | 274.12M | 262.05M | 262.05M | 260.10M | 260.10M | 260.10M |
| Weighted Avg Shares Out (Dil) | 311.60M | 329.22M | 308.15M | 272.43M | 306.40M | 316.04M | 316.28M | 294.95M | 274.14M | 262.07M | 262.05M | 260.10M | 260.10M | 260.10M |

Antero Resources (AR) Up 25.5% Since Last Earnings Report: Can It Continue?

Thankful Investors - Last 5 Years

AR You Ready? Why I'm Super Bullish On Antero Resources

This Is Why Natural Gas Stocks Have Been Surging Lately

Winter to Be Colder: RRC, AR, CRK Stocks to Gain From Gas Demand?

Oil's Ready to Rally: 3 Stocks to Buy as the Energy Sector Heats

New Strong Sell Stocks for November 7th

Antero Resources: Propane Export Premiums Offset Impact Of Weak Natural Gas Prices

Top 3 Energy Stocks That Are Preparing To Pump In November

Antero Resources Corporation (AR) Q3 2024 Earnings Call Transcript
Source: https://incomestatements.info
Category: Stock Reports
