See more : Wisdom Marine Lines Co., Limited (2637.TW) Income Statement Analysis – Financial Results
Complete financial analysis of Astrotech Corporation (ASTC) income statement, including revenue, profit margins, EPS and key performance metrics. Get detailed insights into the financial performance of Astrotech Corporation, a leading company in the Aerospace & Defense industry within the Industrials sector.
- Corvus Gold Inc. (KOR.TO) Income Statement Analysis – Financial Results
- Telephone and Data Systems, Inc. (TDS-PV) Income Statement Analysis – Financial Results
- Guangdong Topstrong Living Innovation and Integration Co., Ltd. (300749.SZ) Income Statement Analysis – Financial Results
- SLM Corporation (SLMBP) Income Statement Analysis – Financial Results
- Simplex Papers Limited (SIMPLXPAP.BO) Income Statement Analysis – Financial Results
Astrotech Corporation (ASTC)
About Astrotech Corporation
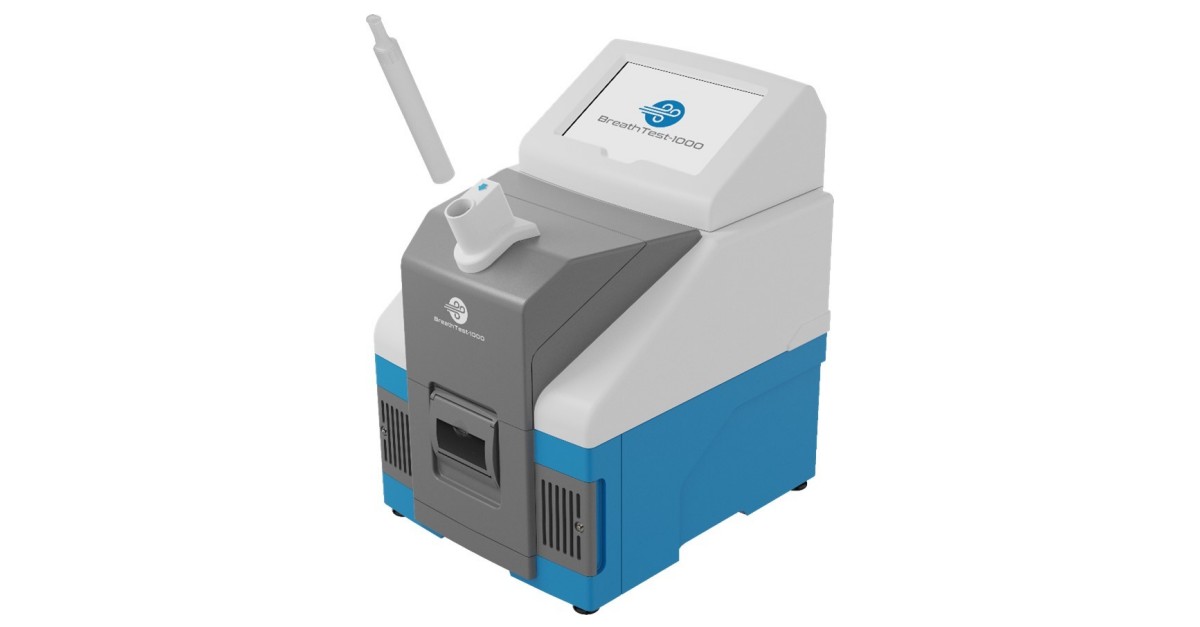
Astrotech Corporation operates as a science and technology development and commercialization company worldwide. It operates through three segments, Astrotech Technologies, Inc. (ATI), 1st Detect Corporation (1st Detect), and AgLAB Inc (AgLAB). The ATI segment owns and licenses the AMS Technology, the platform mass spectrometry technology. The 1st Detect segment manufactures explosives and narcotics trace detectors for use at airports, secured facilities, and borders. This segment provides TRACER 1000, a mass spectrometer based explosives trace detector to replace the explosives trace detectors used at airports, cargo and secured facilities, and borders. The AgLAB segment develops AgLAB-1000, a mass spectrometer for use in the hemp and cannabis market. It also develops BreathTest-1000, a breath analysis tool to screen for volatile organic compound metabolites found in a person's breath. The company was formerly known as SPACEHAB, Inc. and changed its name to Astrotech Corporation in 2009. Astrotech Corporation was incorporated in 1984 is based in Austin, Texas.
| Metric | 2024 | 2023 | 2022 | 2021 | 2020 | 2019 | 2018 | 2017 | 2016 | 2015 | 2014 | 2013 | 2012 | 2011 | 2010 | 2009 | 2008 | 2007 | 2006 | 2005 | 2004 | 2003 | 2002 | 2001 | 2000 | 1999 | 1998 | 1997 | 1995 | 1994 |
|---|---|---|---|---|---|---|---|---|---|---|---|---|---|---|---|---|---|---|---|---|---|---|---|---|---|---|---|---|---|---|
| Revenue | 1.66M | 750.00K | 869.00K | 334.00K | 488.00K | 127.00K | 86.00K | 2.33M | 2.67M | 513.00K | 16.42M | 24.00M | 26.14M | 20.15M | 27.98M | 31.99M | 25.54M | 52.76M | 50.75M | 59.40M | 77.61M | 94.96M | 102.77M | 105.25M | 105.71M | 107.70M | 64.10M | 56.60M | 46.10M | 43.80M |
| Cost of Revenue | 913.00K | 444.00K | 677.00K | 298.00K | 449.00K | 90.00K | 36.00K | 1.29M | 2.33M | 424.00K | 10.71M | 15.68M | 18.79M | 13.67M | 12.86M | 15.72M | 19.54M | 51.03M | 46.86M | 47.16M | 45.68M | 78.79M | 81.77M | 92.24M | 79.18M | 81.80M | 29.20M | 23.90M | 14.80M | 24.23M |
| Gross Profit | 751.00K | 306.00K | 192.00K | 36.00K | 39.00K | 37.00K | 50.00K | 1.04M | 339.00K | 89.00K | 5.72M | 8.31M | 7.35M | 6.48M | 15.12M | 16.26M | 6.00M | 1.73M | 3.89M | 12.24M | 31.93M | 16.17M | 21.01M | 13.01M | 26.53M | 25.90M | 34.90M | 32.70M | 31.30M | 19.57M |
| Gross Profit Ratio | 45.13% | 40.80% | 22.09% | 10.78% | 7.99% | 29.13% | 58.14% | 44.46% | 12.69% | 17.35% | 34.82% | 34.64% | 28.11% | 32.17% | 54.04% | 50.84% | 23.50% | 3.28% | 7.67% | 20.61% | 41.14% | 17.03% | 20.44% | 12.36% | 25.09% | 24.05% | 54.45% | 57.77% | 67.90% | 44.69% |
| Research & Development | 6.79M | 5.59M | 2.78M | 2.69M | 3.44M | 3.58M | 6.07M | 5.59M | 6.47M | 3.23M | 2.51M | 2.08M | 2.57M | 3.83M | 2.80M | 2.33M | 1.38M | 801.00K | 410.00K | 77.00K | 223.00K | 118.00K | 383.00K | 393.00K | 2.44M | 3.60M | 2.60M | 1.30M | 100.00K | 0.00 |
| General & Administrative | 1.36M | 1.46M | 1.50M | 0.00 | 0.00 | 0.00 | 5.63M | 7.51M | 7.71M | 12.97M | 8.89M | 6.79M | 7.07M | 8.40M | 12.17M | 9.76M | 9.15M | 9.88M | 10.67M | 9.38M | 10.91M | 41.17M | 18.74M | 21.80M | 17.83M | 14.60M | 13.70M | 8.60M | 4.60M | 5.06M |
| Selling & Marketing | 5.88M | 4.32M | 4.50M | 0.00 | 0.00 | 0.00 | 0.00 | 0.00 | 0.00 | 0.00 | 0.00 | 0.00 | 0.00 | 0.00 | 0.00 | 0.00 | 0.00 | 0.00 | 0.00 | 0.00 | 0.00 | 0.00 | 0.00 | 0.00 | 0.00 | 0.00 | 0.00 | 0.00 | 800.00K | 0.00 |
| SG&A | 7.24M | 5.78M | 6.01M | 4.74M | 4.72M | 4.88M | 5.63M | 7.51M | 7.71M | 12.97M | 8.89M | 6.79M | 7.07M | 8.40M | 12.17M | 9.76M | 9.15M | 9.88M | 10.67M | 9.38M | 10.91M | 41.17M | 18.74M | 21.80M | 17.83M | 14.60M | 13.70M | 8.60M | 5.40M | 5.06M |
| Other Expenses | 0.00 | 1.42M | 265.00K | 215.00K | 0.00 | 0.00 | 1.66M | 0.00 | 0.00 | 0.00 | 0.00 | 0.00 | 0.00 | 0.00 | 0.00 | 0.00 | 213.00K | 3.88M | 0.00 | -7.74M | 10.07M | 50.27M | 770.00K | 0.00 | 8.75M | 7.50M | 5.80M | 10.20M | 6.20M | 0.00 |
| Operating Expenses | 14.03M | 11.37M | 8.79M | 7.43M | 8.15M | 8.45M | 11.69M | 13.10M | 14.18M | 16.20M | 11.40M | 8.87M | 9.64M | 12.24M | 14.97M | 12.09M | 10.74M | 14.56M | 11.08M | 1.72M | 21.21M | 91.55M | 19.89M | 22.19M | 29.02M | 25.70M | 22.10M | 20.10M | 13.90M | 5.06M |
| Cost & Expenses | 14.94M | 11.81M | 9.46M | 7.73M | 8.60M | 8.54M | 11.73M | 14.39M | 16.51M | 16.62M | 22.10M | 24.55M | 28.43M | 25.90M | 27.83M | 27.81M | 30.28M | 65.59M | 57.94M | 48.87M | 66.88M | 170.34M | 101.66M | 114.43M | 108.20M | 107.50M | 51.30M | 44.00M | 28.70M | 29.29M |
| Interest Income | 0.00 | 0.00 | 0.00 | 275.00K | 197.00K | 25.00K | 0.00 | 0.00 | 0.00 | 0.00 | 0.00 | 0.00 | 0.00 | 0.00 | 0.00 | 0.00 | 0.00 | 0.00 | 0.00 | 0.00 | 0.00 | 0.00 | 0.00 | 0.00 | 0.00 | 0.00 | 0.00 | 0.00 | 114.66K | 0.00 |
| Interest Expense | 0.00 | 0.00 | 265.00K | 235.00K | 197.00K | 0.00 | 0.00 | 0.00 | 0.00 | 224.00K | 0.00 | 164.00K | 1.03M | 279.00K | 459.00K | 622.00K | 427.00K | 0.00 | 0.00 | 0.00 | 0.00 | 0.00 | 0.00 | 0.00 | 0.00 | 0.00 | 0.00 | 0.00 | 1.36M | 0.00 |
| Depreciation & Amortization | 874.00K | 489.00K | 236.00K | 55.00K | 189.00K | 268.00K | 765.00K | 731.00K | 572.00K | 320.00K | 2.31M | 2.12M | 2.24M | 2.32M | 2.14M | 2.21M | 2.67M | 6.36M | 6.06M | 5.53M | 5.88M | 9.39M | 13.41M | 10.57M | 8.75M | 7.50M | 5.80M | 10.20M | 8.50M | 0.00 |
| EBITDA | -12.41M | -10.69M | -8.36M | -7.31M | -7.58M | -8.15M | -10.88M | -11.33M | -13.43M | -15.79M | -10.18M | 1.56M | -47.00K | -3.44M | 2.29M | 7.05M | -4.73M | -5.71M | -792.00K | 16.05M | 16.61M | -66.00M | 14.53M | 1.40M | 6.26M | 7.70M | 18.60M | 22.80M | 25.80M | 14.51M |
| EBITDA Ratio | -745.55% | -1,474.67% | -989.07% | -2,223.35% | -1,553.48% | -6,627.56% | -10,681.40% | -486.64% | -496.67% | -3,078.17% | -20.50% | 6.48% | -0.18% | -17.07% | 8.18% | 22.03% | 110.96% | -4.91% | -2.22% | 13.99% | 34.38% | -16.56% | 14.89% | 1.33% | 5.92% | 7.15% | 22.93% | 37.10% | 55.97% | 33.13% |
| Operating Income | -13.28M | -11.06M | -8.60M | -7.40M | -8.11M | -8.42M | -13.34M | -12.06M | -13.84M | -16.11M | -5.68M | -559.00K | -2.29M | -5.76M | 153.00K | 4.17M | -4.73M | -12.83M | -7.19M | 10.53M | 10.72M | -75.38M | 1.12M | -9.18M | -2.50M | 200.00K | 12.80M | 12.60M | 17.40M | 14.51M |
| Operating Income Ratio | -798.08% | -1,474.67% | -989.07% | -2,214.67% | -1,662.70% | -6,627.56% | -15,508.14% | -518.04% | -518.08% | -3,140.55% | -34.59% | -2.33% | -8.76% | -28.56% | 0.55% | 13.04% | -18.52% | -24.32% | -14.17% | 17.72% | 13.82% | -79.38% | 1.09% | -8.72% | -2.36% | 0.19% | 19.97% | 22.26% | 37.74% | 33.13% |
| Total Other Income/Expenses | 1.62M | 1.42M | 265.00K | -206.00K | -197.00K | 25.00K | 86.00K | 306.00K | 379.00K | 224.00K | -182.00K | -164.00K | -1.03M | -279.00K | -459.00K | 43.00K | -30.62M | -3.53M | -5.17M | -5.42M | -8.14M | -7.25M | -5.53M | -4.49M | -3.11M | -3.30M | -700.00K | 1.00M | -1.36M | -14.51M |
| Income Before Tax | -11.66M | -9.64M | -8.33M | -7.60M | -8.31M | -8.39M | -13.25M | -11.75M | -13.46M | -15.89M | -5.86M | -723.00K | -3.32M | -6.03M | -306.00K | 4.22M | -35.35M | 16.36M | -12.37M | 5.10M | 2.58M | -82.63M | -4.42M | -13.67M | -5.61M | -3.10M | 12.10M | 13.60M | 16.00M | 0.00 |
| Income Before Tax Ratio | -700.96% | -1,285.60% | -958.57% | -2,276.35% | -1,703.07% | -6,607.87% | -15,408.14% | -504.90% | -503.89% | -3,096.88% | -35.69% | -3.01% | -12.69% | -29.95% | -1.09% | 13.18% | -138.40% | 31.01% | -24.37% | 8.59% | 3.33% | -87.01% | -4.30% | -12.99% | -5.30% | -2.88% | 18.88% | 24.03% | 34.71% | 0.00% |
| Income Tax Expense | 2.00K | -489.00K | -766.00K | 3.00K | 197.00K | -858.00K | 86.00K | 2.00K | -25.00K | -5.94M | 6.00K | -538.00K | 17.00K | -53.00K | 22.00K | -510.00K | 675.00K | -69.00K | 32.00K | -146.00K | 506.00K | -857.00K | -2.05M | -886.00K | -1.76M | -500.00K | 2.50M | 3.00M | 200.00K | -8.64M |
| Net Income | -11.67M | -9.64M | -7.56M | -7.61M | -8.51M | -7.53M | -13.25M | -11.58M | -13.10M | 10.78M | -4.96M | -185.00K | -2.71M | -4.98M | 260.00K | 4.73M | -36.03M | -16.29M | -12.40M | 5.25M | 2.08M | -81.78M | -2.37M | -12.79M | -3.84M | -2.60M | 9.60M | 13.90M | 15.80M | 8.64M |
| Net Income Ratio | -701.08% | -1,285.60% | -870.43% | -2,277.25% | -1,743.44% | -5,932.28% | -15,408.14% | -497.51% | -490.27% | 2,100.97% | -30.20% | -0.77% | -10.38% | -24.73% | 0.93% | 14.77% | -141.04% | -30.88% | -24.43% | 8.84% | 2.67% | -86.11% | -2.30% | -12.15% | -3.64% | -2.41% | 14.98% | 24.56% | 34.27% | 19.72% |
| EPS | -7.12 | -5.95 | -4.76 | -10.38 | -40.22 | -45.75 | -97.89 | -85.09 | -96.34 | 78.00 | -38.18 | -1.50 | -21.95 | -41.94 | 3.00 | 43.50 | -583.97 | -1.89K | -1.46K | 630.00 | 255.00 | -9.98K | -298.79 | -1.68K | -511.51 | -348.71 | 1.29K | 1.86K | 3.56K | 2.55K |
| EPS Diluted | -7.12 | -5.95 | -4.76 | -10.38 | -40.22 | -45.75 | -97.89 | -85.08 | -96.34 | 78.00 | -38.18 | -1.44 | -21.95 | -41.94 | 1.50 | 42.00 | -583.97 | -1.89K | -1.46K | 555.00 | 225.00 | -9.98K | -298.79 | -1.68K | -511.51 | -348.71 | 1.26K | 1.86K | 3.56K | 1.94K |
| Weighted Avg Shares Out | 1.64M | 1.62M | 1.59M | 732.80K | 211.53K | 164.67K | 135.37K | 136.12K | 135.92K | 132.07K | 129.91K | 123.33K | 123.63K | 118.81K | 110.45K | 109.10K | 61.70K | 8.61K | 8.50K | 8.41K | 8.30K | 8.19K | 7.92K | 7.60K | 7.52K | 7.46K | 7.44K | 7.41K | 4.45K | 3.39K |
| Weighted Avg Shares Out (Dil) | 1.64M | 1.62M | 1.59M | 732.80K | 211.53K | 164.67K | 135.37K | 136.13K | 135.92K | 132.07K | 129.91K | 128.85K | 123.63K | 118.81K | 121.89K | 112.69K | 61.70K | 8.61K | 8.50K | 9.46K | 9.43K | 8.19K | 7.92K | 7.60K | 7.52K | 7.46K | 9.71K | 7.44K | 4.45K | 4.49K |

Astrotech Announces Closing of $6.2 Million Registered Direct Offering Priced At-the-Market

Astrotech Announces $6.2 Million Registered Direct Offering Priced At-the-Market

Coronavirus update: CDC says nearly 300,000 excess American deaths have occurred during pandemic

ASTC Stock News: Why Astrotech Stock Is Soaring 160% Today

Astrotech's stock skyrockets after JDA with Cleveland Clinic to develop COVID-19 breath test

Astrotech Announces Pricing of $18.0 Million Upsized Public Offering

Astrotech Subsidiary and Cleveland Clinic Partner to Develop a Rapid COVID-19 Breath Test

Analyzing Avantor (NYSE:AVTR) and Astrotech (NYSE:ASTC)

Nearly 100 Cool New Worlds Found in Our Cosmic Backyard With Key Help From Citizen Scientists

Pandemic and Dangerous Weather Events Underscore Need for Seamless Interoperability Between Public Safety Agencies
Source: https://incomestatements.info
Category: Stock Reports
