See more : Rico Auto Industries Limited (RICOAUTO.NS) Income Statement Analysis – Financial Results
Complete financial analysis of Astra Space, Inc. (ASTR) income statement, including revenue, profit margins, EPS and key performance metrics. Get detailed insights into the financial performance of Astra Space, Inc., a leading company in the Aerospace & Defense industry within the Industrials sector.
- Zhongchang Big Data Corporation Limited (600242.SS) Income Statement Analysis – Financial Results
- Genocea Biosciences, Inc. (GNCA) Income Statement Analysis – Financial Results
- FAST Acquisition Corp. II (FZT) Income Statement Analysis – Financial Results
- SRAX, Inc. (SRAX) Income Statement Analysis – Financial Results
- Tenfu (Cayman) Holdings Company Limited (6868.HK) Income Statement Analysis – Financial Results
Astra Space, Inc. (ASTR)
About Astra Space, Inc.
Astra Space, Inc. designs, tests, manufactures, launches, and operates space products and services. The company also designs, tests, manufactures, and operates propulsion modules to enable satellites to orbit in space. Its customers primarily include satellite operators, satellite manufacturers, government agencies, and defense prime contractors. The company was incorporated in 2016 and is headquartered in Alameda, California.
| Metric | 2023 | 2022 | 2021 | 2020 | 2019 |
|---|---|---|---|---|---|
| Revenue | 3.87M | 9.37M | 0.00 | 0.00 | 0.00 |
| Cost of Revenue | 8.13M | 29.53M | 159.26M | 0.00 | 0.00 |
| Gross Profit | -4.25M | -20.16M | -159.26M | 0.00 | 0.00 |
| Gross Profit Ratio | -109.81% | -215.15% | 0.00% | 0.00% | 0.00% |
| Research & Development | 93.16M | 140.67M | 80.40M | 27.54M | 40.07M |
| General & Administrative | 46.42M | 85.29M | 74.75M | 45.95M | 12.52M |
| Selling & Marketing | 5.61M | 17.40M | 4.11M | 0.00 | 0.00 |
| SG&A | 47.96M | 102.69M | 78.86M | 45.95M | 12.52M |
| Other Expenses | 2.12M | 5.67M | 36.05M | 2.72M | 740.00K |
| Operating Expenses | 141.12M | 243.35M | 159.26M | 73.49M | 52.59M |
| Cost & Expenses | 149.25M | 272.88M | 159.26M | 73.49M | 52.59M |
| Interest Income | 1.96M | 1.75M | 0.00 | 46.96K | 0.00 |
| Interest Expense | 3.62M | 1.75M | 1.17M | 5.66M | 870.00K |
| Depreciation & Amortization | 6.32M | 310.68M | 133.78M | 6.02M | 3.07M |
| EBITDA | -145.38M | -242.77M | -318.52M | -67.47M | -49.52M |
| EBITDA Ratio | -3,589.55% | -1,154.45% | 0.00% | 0.00% | 0.00% |
| Operating Income | -145.38M | -418.85M | -159.26M | -73.49M | -52.59M |
| Operating Income Ratio | -3,752.58% | -4,470.14% | 0.00% | 0.00% | 0.00% |
| Total Other Income/Expenses | -33.00M | -22.12M | -98.91M | 5.20M | -594.00K |
| Income Before Tax | -178.38M | -411.44M | -258.17M | -68.29M | -53.18M |
| Income Before Tax Ratio | -4,604.44% | -4,391.01% | 0.00% | 0.00% | 0.00% |
| Income Tax Expense | 6.15M | 288.19M | -385.00K | 8.37M | 1.61M |
| Net Income | -178.38M | -699.63M | -257.78M | -76.67M | -54.79M |
| Net Income Ratio | -4,604.44% | -7,466.68% | 0.00% | 0.00% | 0.00% |
| EPS | -9.28 | -39.49 | -23.81 | -30.67 | -0.22 |
| EPS Diluted | -9.28 | -39.49 | -23.81 | -30.67 | -0.22 |
| Weighted Avg Shares Out | 19.22M | 17.71M | 10.83M | 2.50M | 254.33M |
| Weighted Avg Shares Out (Dil) | 19.22M | 17.71M | 10.83M | 2.50M | 254.33M |

Space Force Awards Astra New Launch Order for Rocket 4

Virgin Orbit was a promising company that could never find a working business model

Astra Takes Action to Protect Shareholders Against Potential Illegal Trading Activities

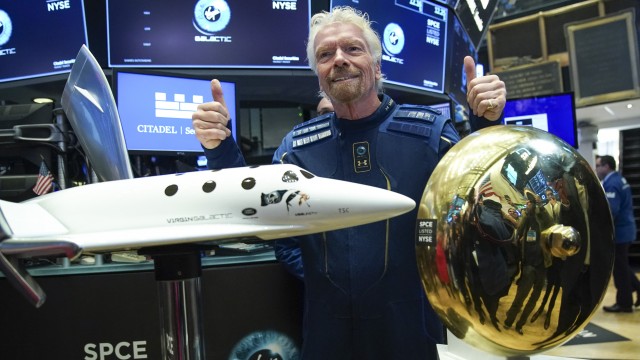
Richard Branson Advances The Science Of SPAC Holes

Astra Space, Inc. (ASTR) Q4 2022 Earnings Call Transcript

KBRA Revises Loan KPOs to Underperform for Nine CMBS Single-Borrower Office Transactions

Astra outlines its plan to avoid Nasdaq delisting, including possible reverse stock split

Astra investigating 'potential illegal short selling' as delisting deadline looms

Astra Investigates Potential Illegal Short Selling

Astra to Report Fourth Quarter 2022 Financial Results on March 30th, 2023
Source: https://incomestatements.info
Category: Stock Reports
