See more : TV Asahi Holdings Corporation (TVAHF) Income Statement Analysis – Financial Results
Complete financial analysis of Australian Vanadium Limited (ATVVF) income statement, including revenue, profit margins, EPS and key performance metrics. Get detailed insights into the financial performance of Australian Vanadium Limited, a leading company in the Industrial Materials industry within the Basic Materials sector.
- RAC Electric Vehicles Inc. (2237.TWO) Income Statement Analysis – Financial Results
- MIC Electronics Limited (MIC.BO) Income Statement Analysis – Financial Results
- Wisher Industrial Co., Ltd. (1465.TW) Income Statement Analysis – Financial Results
- Shin-Etsu Polymer Co.,Ltd. (7970.T) Income Statement Analysis – Financial Results
- Aker Offshore Wind AS (AOW.OL) Income Statement Analysis – Financial Results
Australian Vanadium Limited (ATVVF)
About Australian Vanadium Limited
Australian Vanadium Limited engages in the mineral exploration activities in Australia. The company operates in two segments, Exploration and Energy Storage. It explores for vanadium/titanium, uranium, and other economic resources. The company holds 100% interest in the Australian Vanadium project comprising 15 tenements covering an area of approximately 200 square kilometers located in the Murchison region to the south of Meekatharra of Western Australia. It also develops and sells vanadium redox flow battery systems. The company was formerly known as Yellow Rock Resources Limited and changed its name to Australian Vanadium Limited in December 2015. Australian Vanadium Limited was incorporated in 2005 and is based in West Perth, Australia.
| Metric | 2024 | 2023 | 2022 | 2021 | 2020 | 2019 | 2018 | 2017 | 2016 | 2015 | 2014 | 2013 | 2012 | 2011 | 2010 | 2009 | 2008 | 2007 |
|---|---|---|---|---|---|---|---|---|---|---|---|---|---|---|---|---|---|---|
| Revenue | 0.00 | 30.50K | -34.33K | 34.33K | 0.00 | 0.00 | 0.00 | 183.02K | 290.01K | 200.25K | 380.19K | 438.77K | 0.00 | 0.00 | 0.00 | 0.00 | 0.00 | 0.00 |
| Cost of Revenue | 630.00K | 3.05M | -26.43K | 26.43K | 120.43K | 62.66K | 44.43K | 40.34K | 3.37K | 0.00 | 0.00 | 0.00 | 0.00 | 0.00 | 0.00 | 0.00 | 0.00 | 0.00 |
| Gross Profit | -630.00K | -3.02M | -7.90K | 7.90K | -120.43K | -62.66K | -44.43K | 142.68K | 286.63K | 200.25K | 380.19K | 438.77K | 0.00 | 0.00 | 0.00 | 0.00 | 0.00 | 0.00 |
| Gross Profit Ratio | 0.00% | -9,911.43% | 23.00% | 23.00% | 0.00% | 0.00% | 0.00% | 77.96% | 98.84% | 100.00% | 100.00% | 100.00% | 0.00% | 0.00% | 0.00% | 0.00% | 0.00% | 0.00% |
| Research & Development | 0.00 | 0.00 | 0.00 | 0.00 | 0.00 | 0.00 | 0.00 | 0.00 | 0.00 | 0.00 | 0.00 | 0.00 | 0.00 | 0.00 | 0.00 | 0.00 | 0.00 | 0.00 |
| General & Administrative | 4.00M | 4.34M | 3.91M | 2.12M | 2.20M | 1.75M | 2.41M | 1.91M | 1.33M | 1.03M | 576.90K | 481.10K | 1.89M | 382.76K | 322.60K | 261.45K | 1.15M | 77.73K |
| Selling & Marketing | 6.78M | 163.38K | 0.00 | 0.00 | 0.00 | 0.00 | 0.00 | 0.00 | 0.00 | 0.00 | 0.00 | 0.00 | 0.00 | 0.00 | 0.00 | 0.00 | 0.00 | 0.00 |
| SG&A | 10.78M | 4.50M | 3.91M | 2.12M | 2.20M | 1.75M | 2.41M | 1.91M | 1.33M | 1.03M | 576.90K | 481.10K | 1.89M | 382.76K | 322.60K | 261.45K | 1.15M | 77.73K |
| Other Expenses | 0.00 | -25.45K | 88.42K | 122.53K | 104.63K | 124.55K | 160.26K | 127.81K | 262.15K | 148.69K | 368.46K | 391.59K | 42.45K | 268.22K | 0.00 | 0.00 | 0.00 | 0.00 |
| Operating Expenses | 10.78M | 4.52M | 5.11M | 3.27M | 2.84M | 5.45M | 2.71M | 2.26M | 1.58M | 1.63M | 12.45M | 831.03K | 8.66M | 9.62M | 9.63M | 23.23M | 1.52M | 229.42K |
| Cost & Expenses | 11.41M | 7.58M | 5.08M | 3.30M | 2.84M | 5.45M | 2.71M | 2.26M | 1.58M | 1.63M | 12.45M | 831.03K | 8.66M | 9.62M | 9.63M | 23.23M | 1.52M | 229.42K |
| Interest Income | 0.00 | 266.24K | 2.25K | 23.51K | 54.21K | 108.39K | 59.07K | 55.21K | 27.86K | 51.56K | 11.72K | 47.18K | 130.78K | 188.73K | 140.47K | 122.56K | 157.79K | 111.30K |
| Interest Expense | 0.00 | 85.57K | 9.08K | 987.00 | 36.14K | 0.00 | 0.00 | 0.00 | 0.00 | 0.00 | 0.00 | 0.00 | 0.00 | 0.00 | 0.00 | 0.00 | 0.00 | 0.00 |
| Depreciation & Amortization | 3.23M | 323.70K | 111.92K | 132.71K | 120.43K | 62.66K | 44.43K | 40.34K | 3.37K | 4.34K | 4.63K | 5.70K | 3.26K | 576.00 | 576.00 | 161.00 | 0.00 | 0.00 |
| EBITDA | -12.23M | -6.91M | -5.01M | -3.01M | -2.72M | -5.39M | -2.66M | -2.22M | -1.27M | -1.63M | -12.45M | -825.34K | -8.66M | -9.61M | -7.94M | -22.37M | -1.52M | -229.42K |
| EBITDA Ratio | 0.00% | -23,682.49% | 14,582.74% | -8,759.51% | 0.00% | 0.00% | 0.00% | -1,213.17% | -541.97% | -813.95% | -3,274.30% | -188.10% | 0.00% | 0.00% | 0.00% | 0.00% | 0.00% | 0.00% |
| Operating Income | -11.41M | -7.55M | -5.12M | -3.14M | -2.84M | -5.45M | -2.71M | -2.26M | -1.58M | -1.63M | -12.45M | -831.03K | -8.66M | -9.62M | -7.94M | -22.37M | -1.52M | -229.42K |
| Operating Income Ratio | 0.00% | -24,743.80% | 14,908.75% | -9,146.10% | 0.00% | 0.00% | 0.00% | -1,235.21% | -543.13% | -816.12% | -3,275.51% | -189.40% | 0.00% | 0.00% | 0.00% | 0.00% | 0.00% | 0.00% |
| Total Other Income/Expenses | -3.79M | -402.88K | -218.09K | -1.53M | 122.70K | -4.79M | -697.82K | 183.02K | 290.01K | -978.29K | -11.84M | 0.00 | 173.23K | 456.95K | -3.23M | -1.60M | 157.79K | 0.00 |
| Income Before Tax | -15.20M | -7.24M | -5.04M | -3.14M | -2.71M | -5.22M | -2.49M | -2.08M | -1.29M | -1.43M | -12.07M | -392.26K | -8.49M | -9.16M | -11.17M | -23.98M | -1.37M | -118.12K |
| Income Before Tax Ratio | 0.00% | -23,737.32% | 14,671.07% | -9,148.98% | 0.00% | 0.00% | 0.00% | -1,135.21% | -443.13% | -716.12% | -3,175.51% | -89.40% | 0.00% | 0.00% | 0.00% | 0.00% | 0.00% | 0.00% |
| Income Tax Expense | 0.00 | 5.00 | 6.83K | 123.51K | -18.07K | -108.39K | -59.07K | -55.21K | -27.86K | -51.56K | -11.72K | -47.18K | -130.78K | -188.73K | 1.55M | 739.00K | 0.00 | 0.00 |
| Net Income | -15.20M | -7.24M | -5.04M | -3.14M | -2.71M | -5.22M | -2.49M | -2.08M | -1.29M | -1.43M | -12.07M | -392.26K | -8.49M | -9.16M | -11.17M | -23.98M | -1.37M | -118.12K |
| Net Income Ratio | 0.00% | -23,737.32% | 14,671.07% | -9,148.98% | 0.00% | 0.00% | 0.00% | -1,135.21% | -443.13% | -716.12% | -3,175.51% | -89.40% | 0.00% | 0.00% | 0.00% | 0.00% | 0.00% | 0.00% |
| EPS | 0.00 | 0.00 | 0.00 | 0.00 | 0.00 | 0.00 | 0.00 | 0.00 | 0.00 | 0.00 | -0.02 | 0.00 | -0.02 | -0.03 | -0.04 | -0.10 | -0.01 | 0.00 |
| EPS Diluted | 0.00 | 0.00 | 0.00 | 0.00 | 0.00 | 0.00 | 0.00 | 0.00 | 0.00 | 0.00 | -0.02 | 0.00 | -0.02 | -0.03 | -0.04 | -0.10 | -0.01 | 0.00 |
| Weighted Avg Shares Out | 6.31B | 4.26B | 3.38B | 2.84B | 2.41B | 1.81B | 1.44B | 1.14B | 807.80M | 738.04M | 508.50M | 393.87M | 393.87M | 360.02M | 309.16M | 234.08M | 170.21M | 26.54M |
| Weighted Avg Shares Out (Dil) | 6.30B | 4.26B | 3.38B | 2.84B | 2.41B | 1.81B | 1.44B | 1.14B | 807.80M | 763.29M | 526.03M | 393.87M | 393.87M | 360.02M | 309.16M | 234.08M | 170.21M | 26.54M |
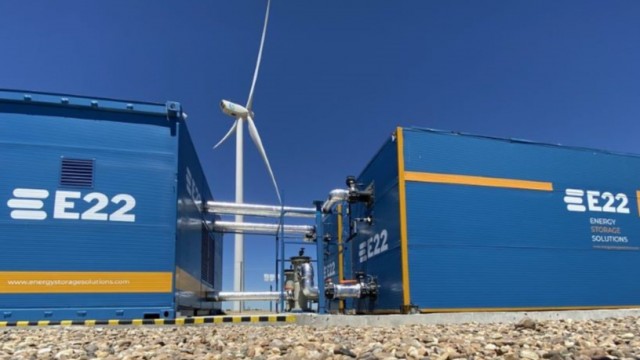
Australian Vanadium subsidiary VSUN Energy to trial VRFB standalone power system at major IGO operation
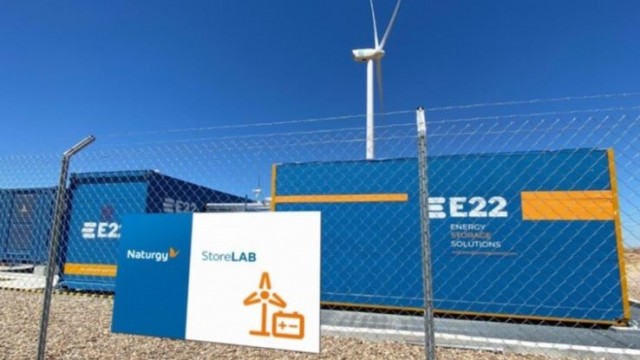
Australian Vanadium signs MOU with Spanish vanadium redox flow battery specialist

Australian Vanadium signs offtake LOI with Shenglong Metallurgy
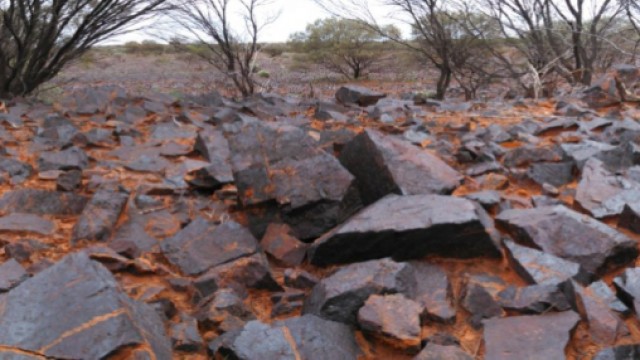
Australian Vanadium reports 14.8% increase in vanadium resource at namesake project

Vanadium Miners News For The Month Of October 2021

Australian Vanadium partner Bryah confirms multiple structural gold targets at Gabanintha

Australian Vanadium doubles down on EM conductors at Coates Project in WA
Vanadium Miners News For The Month Of September 2021
Australian Vanadium awards first stage of electrolyte manufacturing plant build to Primero
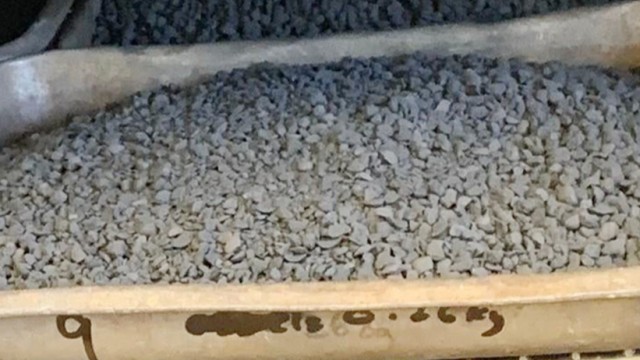
Australian Vanadium reports higher vanadium and iron grades in test-work
Source: https://incomestatements.info
Category: Stock Reports
