See more : Beijing ZZNode Technologies Co., Ltd. (003007.SZ) Income Statement Analysis – Financial Results
Complete financial analysis of Applied UV, Inc. (AUVI) income statement, including revenue, profit margins, EPS and key performance metrics. Get detailed insights into the financial performance of Applied UV, Inc., a leading company in the Furnishings, Fixtures & Appliances industry within the Consumer Cyclical sector.
- Georgetown Corporation (GTCP) Income Statement Analysis – Financial Results
- TLG Immobilien AG (TLG.DE) Income Statement Analysis – Financial Results
- Wüstenrot & Württembergische AG (WWUEY) Income Statement Analysis – Financial Results
- Harrys Manufacturing Inc. (WSRRF) Income Statement Analysis – Financial Results
- Hygieia Group Limited (1650.HK) Income Statement Analysis – Financial Results
Applied UV, Inc. (AUVI)
Industry: Furnishings, Fixtures & Appliances
Sector: Consumer Cyclical
Website: https://www.applieduvinc.com
About Applied UV, Inc.
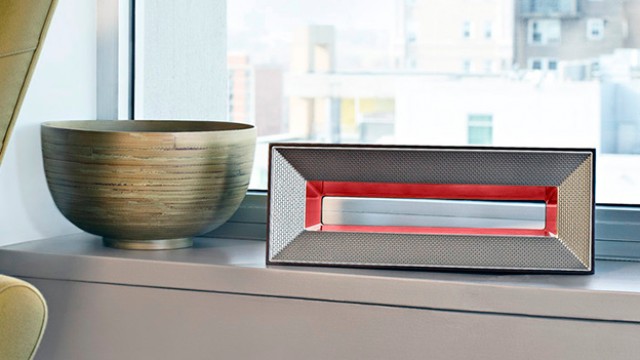
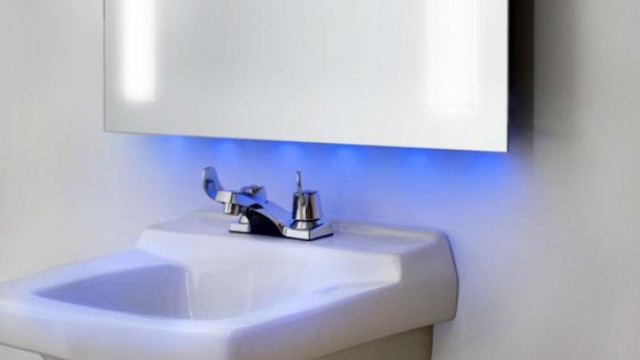
Applied UV, Inc., through its subsidiaries, develops, acquires, and commercializes technology that addresses air purification and infection control in the healthcare, hospitality, commercial, municipal, and residential markets in the United States, Canada, and Europe. It operates through Disinfection and Hospitality segments. The company offers science-based solutions and products in air purification under the Airocide brand; and disinfection of hard surfaces under the Lumicide brand. It also manufactures and supplies fine decorative framed mirrors, framed arts, and bathroom vanities. The company was incorporated in 2019 and is headquartered in Mount Vernon, New York.
| Metric | 2023 | 2022 | 2021 | 2020 | 2019 | 2018 |
|---|---|---|---|---|---|---|
| Revenue | 40.72M | 20.14M | 11.67M | 5.73M | 9.33M | 7.56M |
| Cost of Revenue | 32.89M | 16.10M | 7.57M | 4.72M | 6.01M | 4.89M |
| Gross Profit | 7.83M | 4.04M | 4.10M | 1.01M | 3.32M | 2.67M |
| Gross Profit Ratio | 19.22% | 20.05% | 35.13% | 17.61% | 35.59% | 35.29% |
| Research & Development | 552.22K | 319.17K | 53.41K | 310.67K | 0.00 | 0.00 |
| General & Administrative | 19.71M | 13.69M | 10.54M | 4.01M | 1.92M | 1.91M |
| Selling & Marketing | 661.83K | 1.11M | 799.80K | 317.56K | 0.00 | 0.00 |
| SG&A | 20.37M | 14.80M | 11.34M | 4.01M | 1.92M | 1.91M |
| Other Expenses | 261.84K | 274.76K | 24.87K | 10.94K | 0.00 | 2.55K |
| Operating Expenses | 20.92M | 15.12M | 11.40M | 4.32M | 1.92M | 1.91M |
| Cost & Expenses | 53.81M | 31.22M | 18.96M | 9.05M | 7.93M | 6.80M |
| Interest Income | 0.00 | 290.34K | 0.00 | 0.00 | 15.74K | 0.00 |
| Interest Expense | 1.74M | 290.34K | 0.00 | 0.00 | 15.74K | 35.64K |
| Depreciation & Amortization | 4.04M | 3.48M | 1.79M | 17.64K | 8.12K | 6.25K |
| EBITDA | -9.05M | -8.87M | -5.71M | -3.30M | 1.41M | 762.13K |
| EBITDA Ratio | -21.59% | -37.76% | -47.17% | -57.48% | 15.13% | 10.09% |
| Operating Income | -19.57M | -11.08M | -7.30M | -3.31M | 1.40M | 753.33K |
| Operating Income Ratio | -48.06% | -55.04% | -62.54% | -57.79% | 15.04% | 9.97% |
| Total Other Income/Expenses | 6.36M | -5.49M | -185.44K | 10.94K | 1.50M | -33.09K |
| Income Before Tax | -13.20M | -16.58M | -7.48M | -3.30M | 2.91M | 720.24K |
| Income Before Tax Ratio | -32.43% | -82.30% | -64.13% | -57.60% | 31.17% | 9.53% |
| Income Tax Expense | 2.00M | 5.47M | -91.82K | 66.85K | 106.86K | 2.55K |
| Net Income | -13.20M | -22.05M | -7.39M | -3.37M | 2.80M | 720.24K |
| Net Income Ratio | -32.43% | -109.49% | -63.34% | -58.76% | 30.03% | 9.53% |
| EPS | -35.63 | -216.09 | -99.62 | -73.44 | 63.75 | 17.50 |
| EPS Diluted | -35.63 | -216.09 | -99.62 | -73.44 | 63.75 | 17.50 |
| Weighted Avg Shares Out | 370.57K | 102.04K | 74.19K | 45.87K | 40.26K | 41.16K |
| Weighted Avg Shares Out (Dil) | 370.57K | 102.04K | 74.19K | 45.87K | 40.26K | 41.16K |

MICS, AERC: 5 Top Short Squeeze Stocks to Watch

Best Penny Stocks To Buy Now? 4 To Watch After June's Fed Meeting

3 Good Penny Stocks to Watch During the Market Crash

Applied UV News: Why AUVI Stock Is Skyrocketing 50% Today

Why Applied UV Shares Are Soaring Higher Today

Applied UV to Present and Showcase Airocide and Scientific Air Technology at the LD Micro Invitation June 8th, 2022

Applied UV, Inc. (AUVI) CEO John Andrews on Q1 2022 Results - Earnings Call Transcript

Applied UV Reports 1st Quarter 2022 Results

Why Applied UV Shares Are Surging Today

Applied UV Reports Fourth Quarter and Full-Year 2021 Results
Source: https://incomestatements.info
Category: Stock Reports
