See more : BrightSpire Capital, Inc. (BRSP) Income Statement Analysis – Financial Results
Complete financial analysis of Avianca Holdings S.A. (AVHOQ) income statement, including revenue, profit margins, EPS and key performance metrics. Get detailed insights into the financial performance of Avianca Holdings S.A., a leading company in the Airlines, Airports & Air Services industry within the Industrials sector.
- Shanghai Supezet Engineering Technology Corp., Ltd. (688121.SS) Income Statement Analysis – Financial Results
- FrankSpeech Network, Inc. (INCTD) Income Statement Analysis – Financial Results
- Nintendo Co., Ltd. (0R1E.L) Income Statement Analysis – Financial Results
- Nien Hsing Textile Co., Ltd. (1451.TW) Income Statement Analysis – Financial Results
- TTI Enterprise Limited (TTIENT.BO) Income Statement Analysis – Financial Results
Avianca Holdings S.A. (AVHOQ)
Industry: Airlines, Airports & Air Services
Sector: Industrials
Website: https://www.aviancaholdings.com
About Avianca Holdings S.A.
Avianca Holdings S.A., together with its subsidiaries, provides passenger and cargo air transportation services in the United States, Central America and the Caribbean, Colombia, rest of South America, and internationally. The company operates in two segments, Air Transportation and Loyalty. It also offers aircraft maintenance, crew training, and other airport services to other carriers. In addition, the company provides meals and beverages, baggage handling, in-flight entertainment, and charter flight services, as well as unaccompanied minors and lounge passes; leases aircraft space for check-in counters, ticket sales facilities, VIP lounges, and back office; and engages in the marketing rebates, duty-free sales, and ticket sales activities. Further, it operates LifeMiles, a frequent flyer program. As of December 31, 2020, it operated a fleet of 146 aircraft, including 135 passenger aircraft and 11 cargo transport aircraft. The company was formerly known as AviancaTaca Holding S.A. and changed its name to Avianca Holdings S.A. in March 2013. The company was founded in 1919 and is headquartered in Bogotá, Colombia. Avianca Holdings S.A. is a subsidiary of BRW Aviation LLC. On May 10, 2020, Avianca Holdings S.A., along with its affiliates, filed a voluntary petition for reorganization under Chapter 11 in the U.S. Bankruptcy Court for the Southern District of New York.
| Metric | 2020 | 2019 | 2018 | 2017 | 2016 | 2015 | 2014 | 2013 | 2012 | 2011 |
|---|---|---|---|---|---|---|---|---|---|---|
| Revenue | 1.71B | 4.62B | 4.89B | 4.44B | 4.14B | 4.36B | 4.70B | 4.61B | 4.27B | 3.79B |
| Cost of Revenue | 1.77B | 3.79B | 3.92B | 3.46B | 3.15B | 3.35B | 3.65B | 3.38B | 3.26B | 2.91B |
| Gross Profit | -57.49M | 828.11M | 966.35M | 986.58M | 991.35M | 1.01B | 1.05B | 1.23B | 1.01B | 887.91M |
| Gross Profit Ratio | -3.36% | 17.92% | 19.76% | 22.21% | 23.96% | 23.11% | 22.33% | 26.61% | 23.66% | 23.40% |
| Research & Development | 0.00 | 0.00 | 0.00 | 0.00 | 0.00 | 0.00 | 0.00 | 0.00 | 0.00 | 0.00 |
| General & Administrative | 367.45M | 411.57M | 203.30M | 177.86M | 187.56M | 176.20M | 165.17M | 257.27M | 206.67M | 184.70M |
| Selling & Marketing | 169.28M | 500.16M | 530.93M | 515.07M | 545.32M | 612.78M | 605.67M | 584.47M | 522.65M | 500.82M |
| SG&A | 536.73M | 911.73M | 734.23M | 692.94M | 732.88M | 788.97M | 770.85M | 841.74M | 729.31M | 685.52M |
| Other Expenses | 0.00 | 0.00 | 0.00 | 0.00 | 0.00 | 0.00 | 0.00 | 0.00 | 0.00 | 0.00 |
| Operating Expenses | 536.73M | 911.73M | 734.23M | 692.94M | 732.88M | 788.97M | 770.85M | 841.74M | 729.31M | 685.52M |
| Cost & Expenses | 2.31B | 4.71B | 4.66B | 4.15B | 3.88B | 4.14B | 4.42B | 4.22B | 3.99B | 3.59B |
| Interest Income | 4.41M | 9.04M | 10.12M | 14.53M | 13.05M | 19.02M | 17.10M | 11.57M | 25.01M | 33.65M |
| Interest Expense | 378.32M | 299.94M | 212.29M | 183.33M | 172.63M | 169.41M | 133.99M | 113.33M | 122.11M | 90.78M |
| Depreciation & Amortization | 532.99M | 593.40M | 389.39M | 313.41M | 269.55M | 230.73M | 198.66M | 169.58M | 122.08M | 126.51M |
| EBITDA | -126.19M | 3.61M | 597.09M | 565.09M | 520.45M | 291.66M | 512.20M | 586.86M | 344.04M | 359.99M |
| EBITDA Ratio | -7.37% | 0.08% | 12.21% | 12.72% | 12.58% | 6.69% | 10.89% | 12.73% | 8.06% | 9.49% |
| Operating Income | -594.22M | -83.62M | 232.12M | 293.64M | 258.47M | 218.82M | 279.47M | 384.93M | 280.90M | 202.38M |
| Operating Income Ratio | -34.72% | -1.81% | 4.75% | 6.61% | 6.25% | 5.02% | 5.94% | 8.35% | 6.58% | 5.33% |
| Total Other Income/Expenses | -450.49M | -786.39M | -210.76M | -191.50M | -180.19M | -327.29M | -100.69M | -89.65M | -177.94M | -58.69M |
| Income Before Tax | -1.04B | -870.01M | 21.36M | 102.14M | 78.28M | -108.48M | 178.77M | 295.28M | 102.96M | 143.69M |
| Income Before Tax Ratio | -61.04% | -18.83% | 0.44% | 2.30% | 1.89% | -2.49% | 3.80% | 6.41% | 2.41% | 3.79% |
| Income Tax Expense | 49.43M | 23.98M | 20.21M | 20.11M | 34.09M | 31.03M | 50.28M | 46.46M | 64.71M | 43.81M |
| Net Income | -1.09B | -913.71M | -24.80M | 48.24M | 44.19M | -139.51M | 129.27M | 257.49M | 35.14M | 98.89M |
| Net Income Ratio | -63.50% | -19.77% | -0.51% | 1.09% | 1.07% | -3.20% | 2.75% | 5.59% | 0.82% | 2.61% |
| EPS | -8.72 | -7.33 | -0.20 | 0.39 | 0.35 | -1.12 | 1.04 | 2.25 | 0.28 | 0.90 |
| EPS Diluted | -8.72 | -7.33 | -0.20 | 0.39 | 0.35 | -1.12 | 1.04 | 2.25 | 0.28 | 0.90 |
| Weighted Avg Shares Out | 124.62M | 124.62M | 124.62M | 124.62M | 124.62M | 124.62M | 124.62M | 114.21M | 124.94M | 109.54M |
| Weighted Avg Shares Out (Dil) | 124.62M | 124.62M | 124.62M | 124.62M | 124.62M | 124.62M | 124.62M | 114.21M | 124.94M | 109.54M |

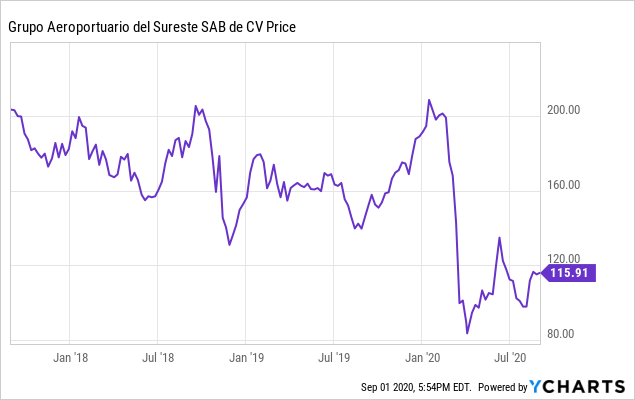
Colombia Bails Out Avianca Airlines, Revives Airport Operator Sureste's Bull Case

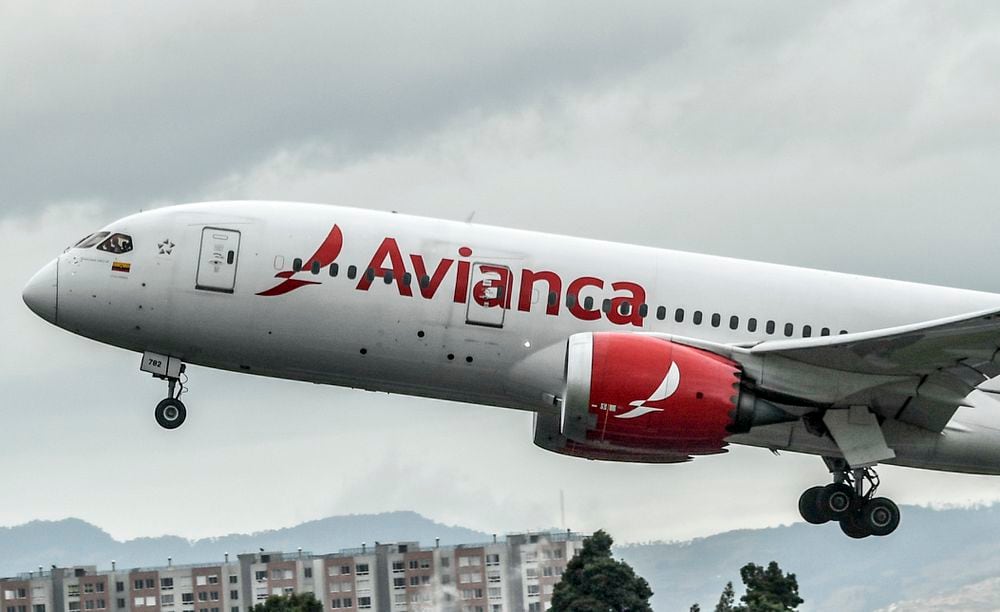
El Gobierno colombiano estudia salvar a Avianca con un préstamo
Source: https://incomestatements.info
Category: Stock Reports
